Visualizing Dogs in New York
Term
Course
Instructor
Partner
Program
Course
Instructor
Partner
Program
Fall Harvard GSD
CS109a Intro to Data Science
Pavlos Protopapas, Natesh Pillai
Yunsong Liu
Html, CSS, Javascript, D3
CS109a Intro to Data Science
Pavlos Protopapas, Natesh Pillai
Yunsong Liu
Html, CSS, Javascript, D3
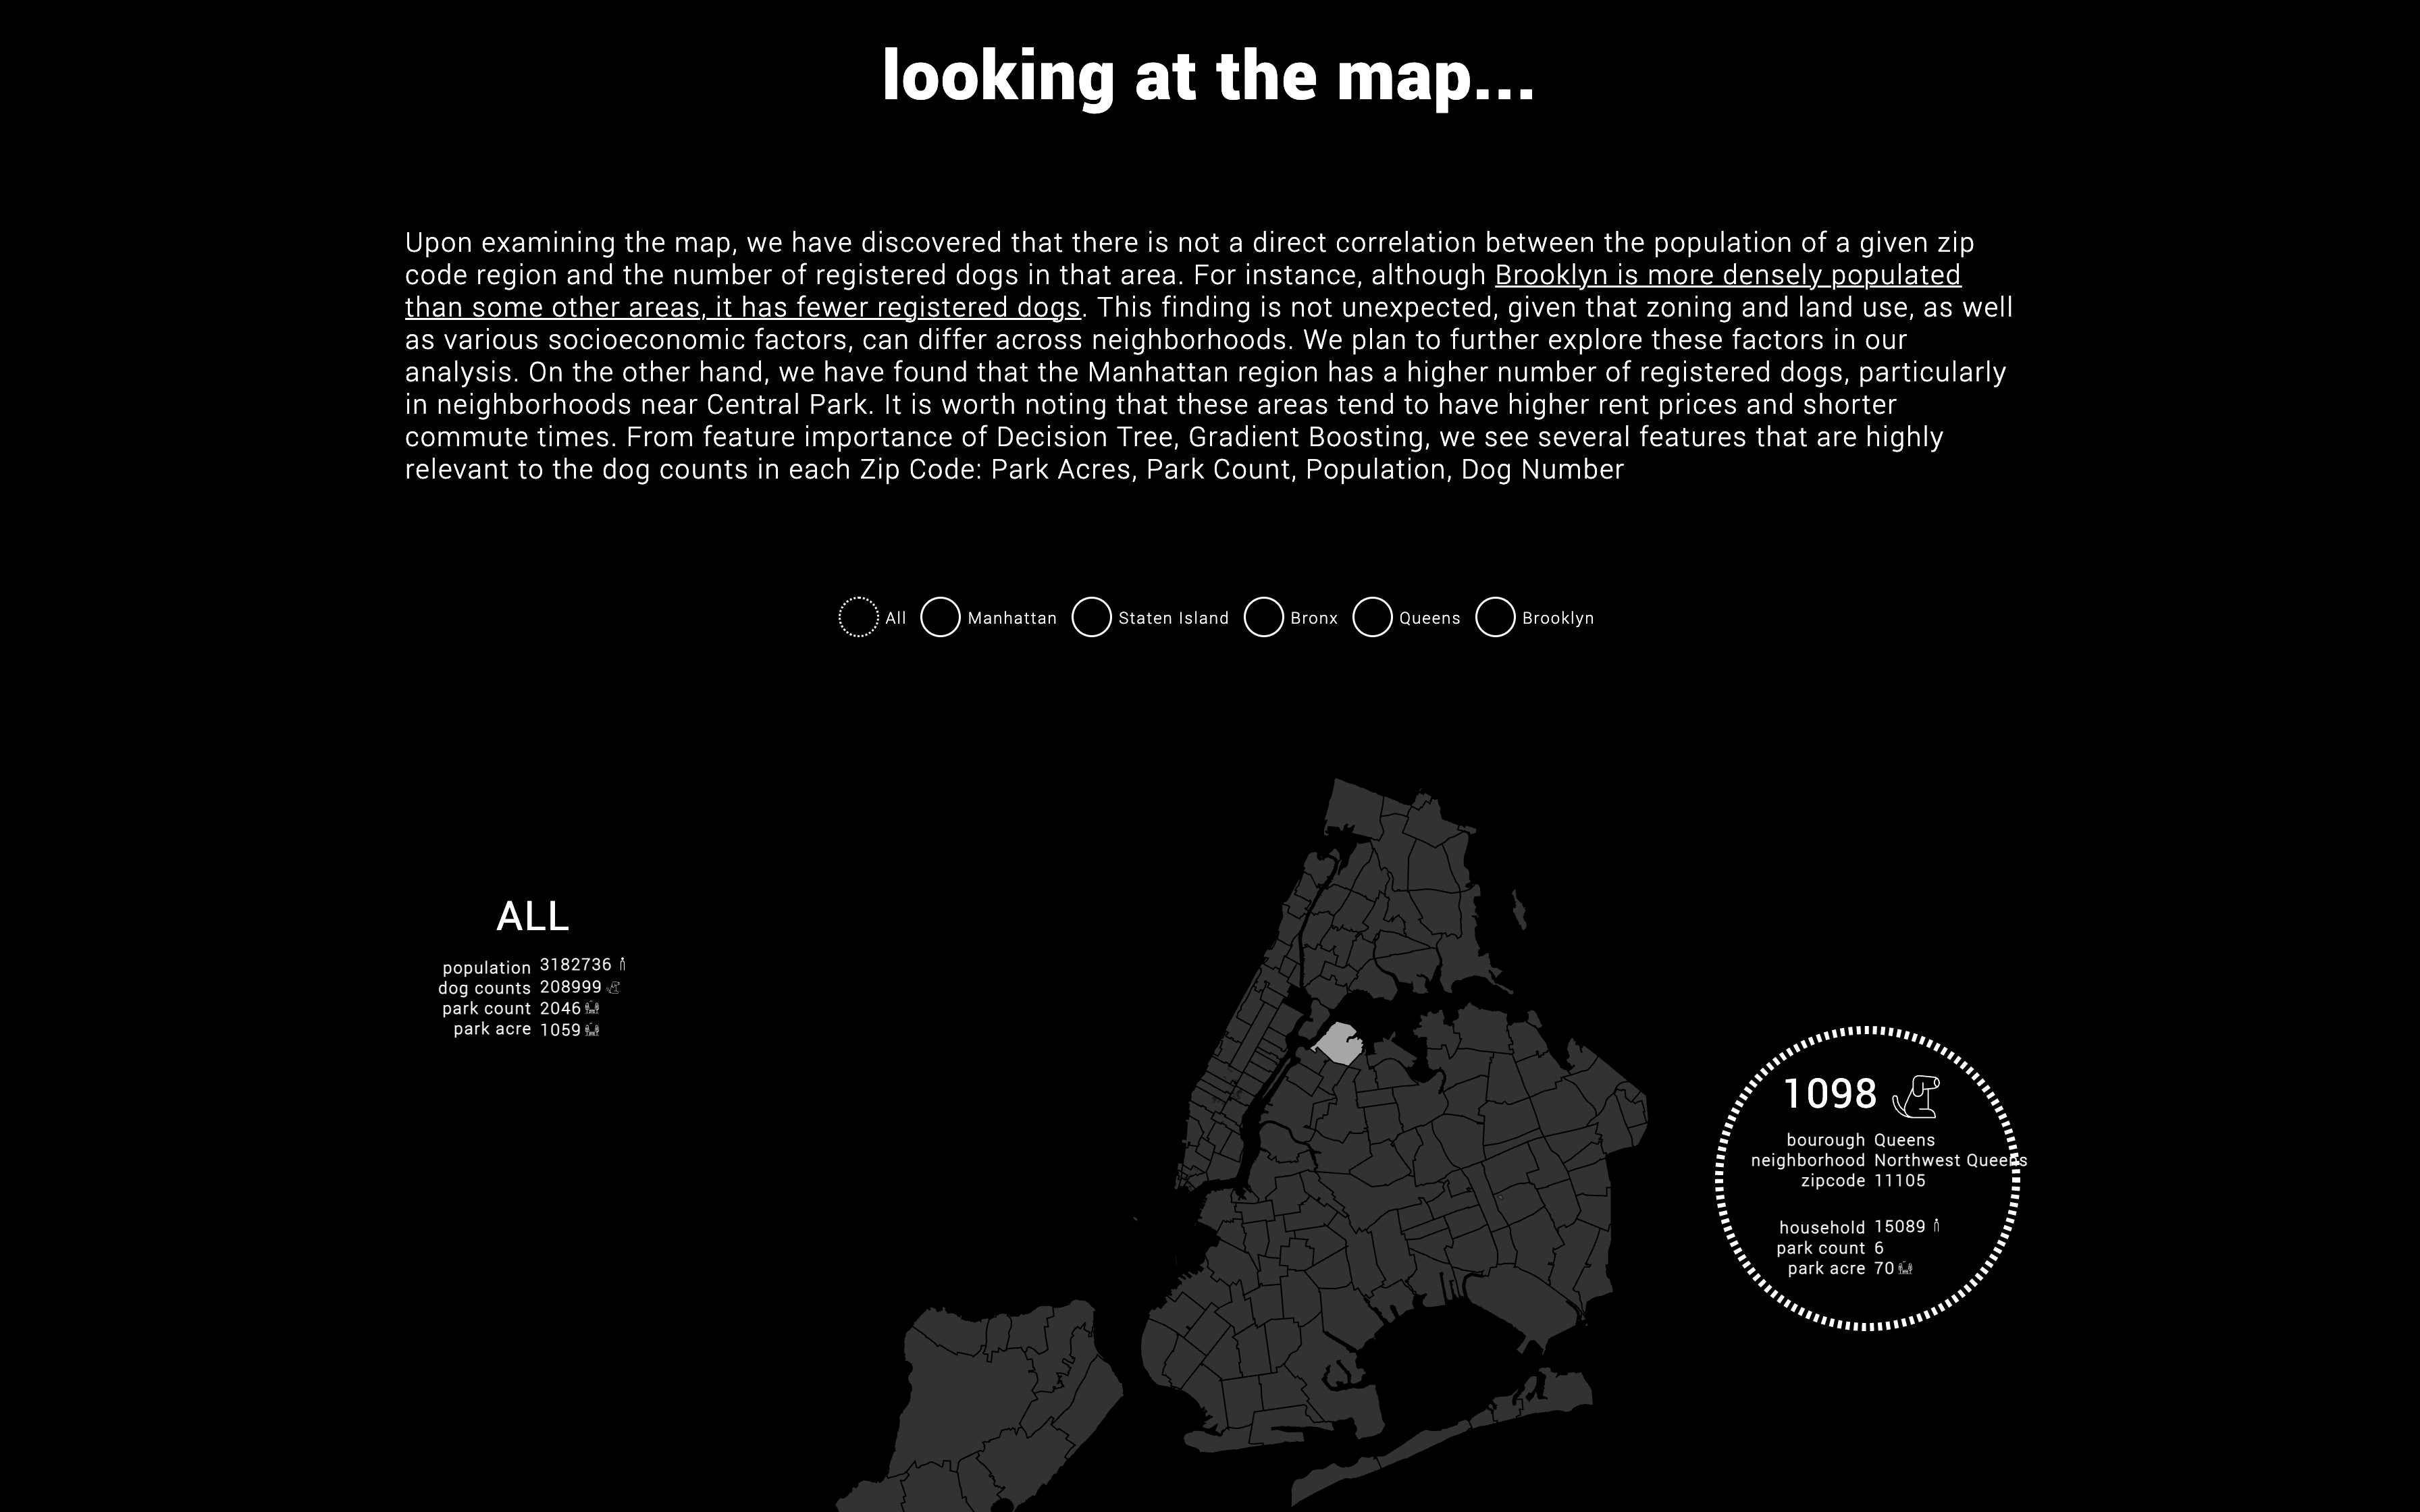
The project aims to analyze the relationship between social and spatial factors and provide insight into the intangible and physical organization of the city through the perspective of dogs and their daily routines. It will explore socio-economic indicators such as property values, neighborhood quality, proximity to open spaces like parks, and walkability of the urban environment to visualize the city's spatial characteristics.
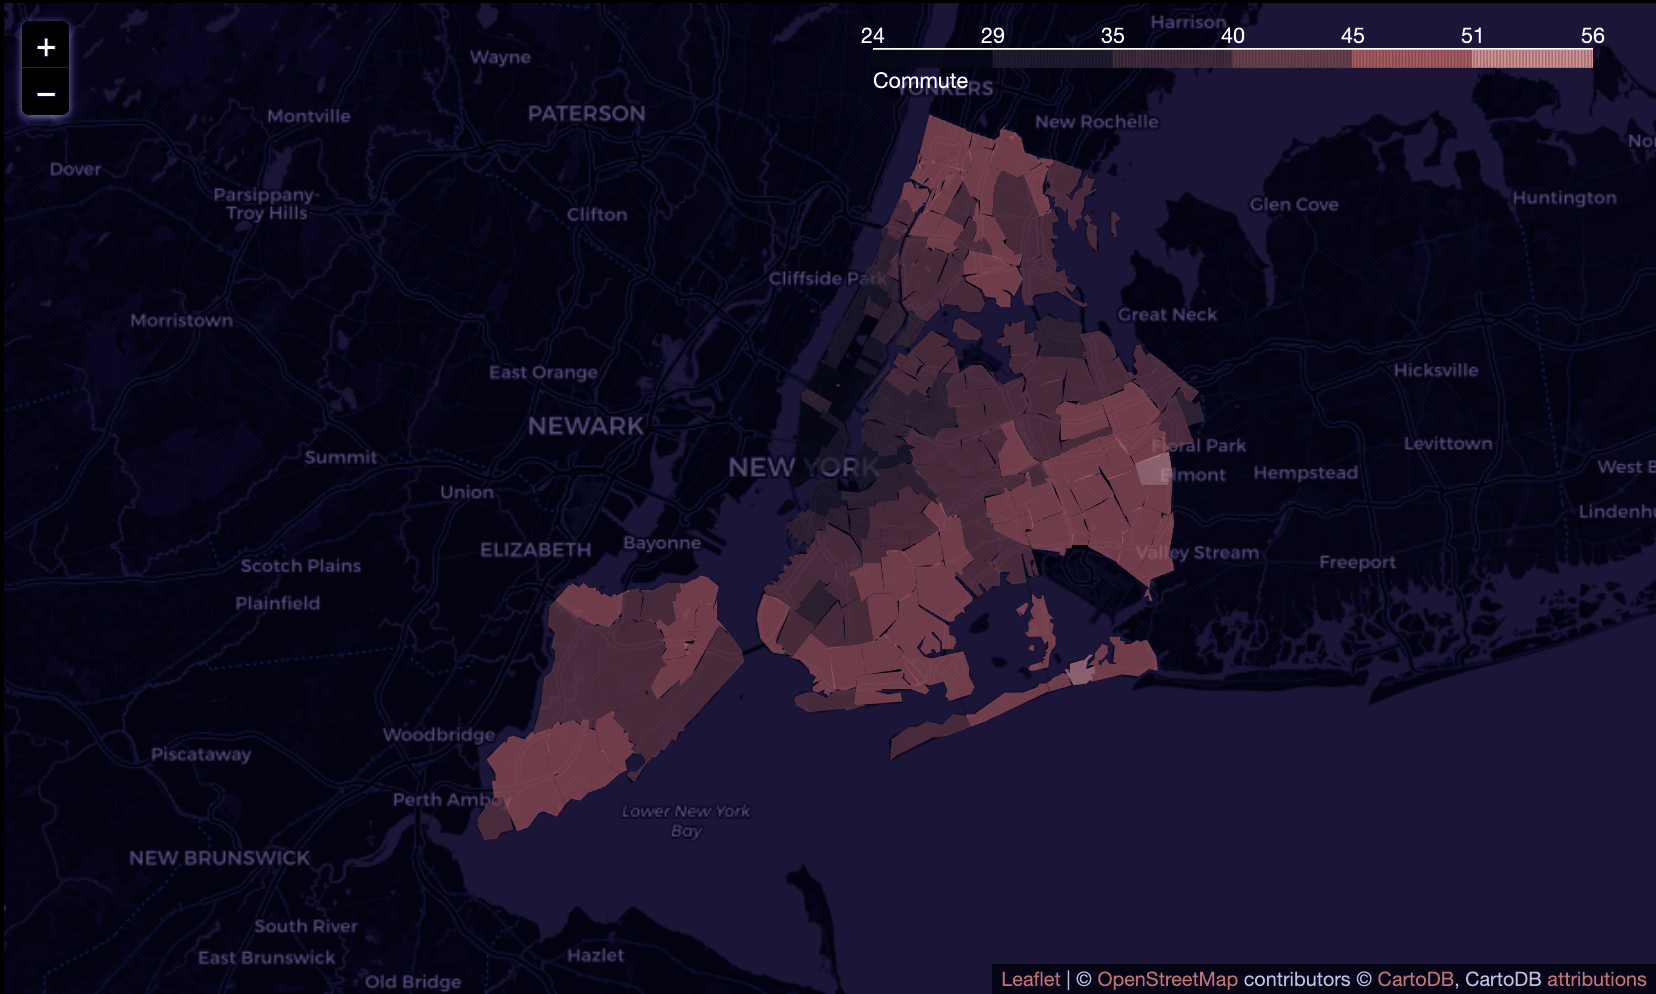
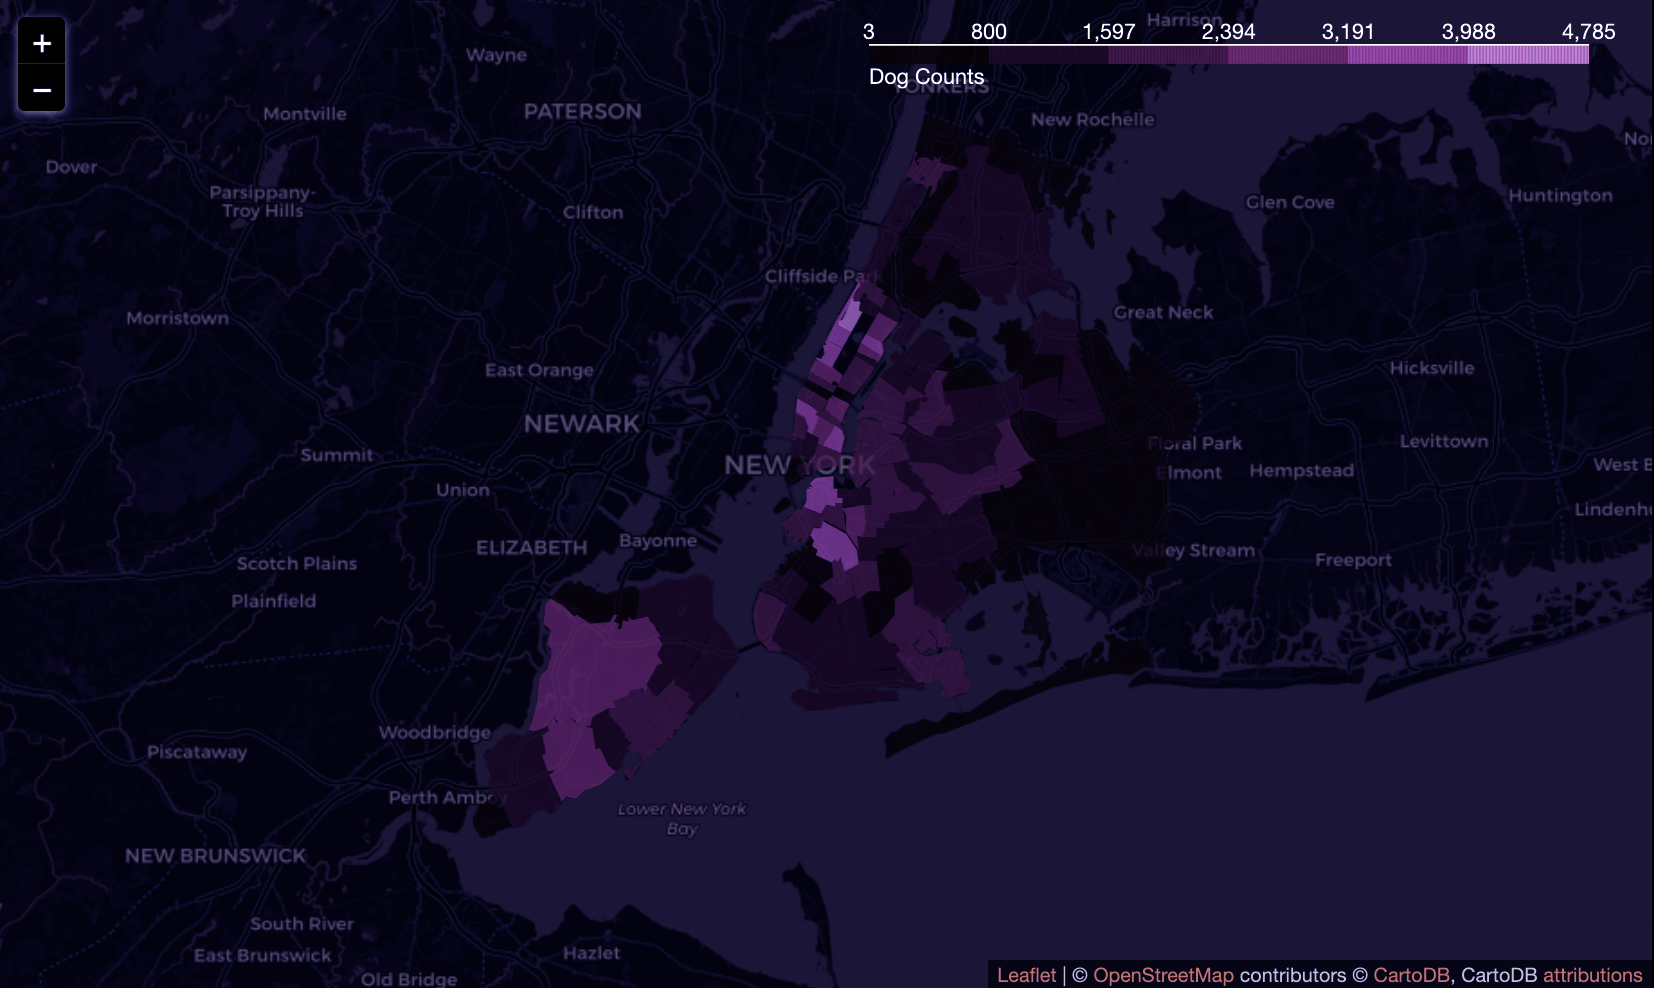
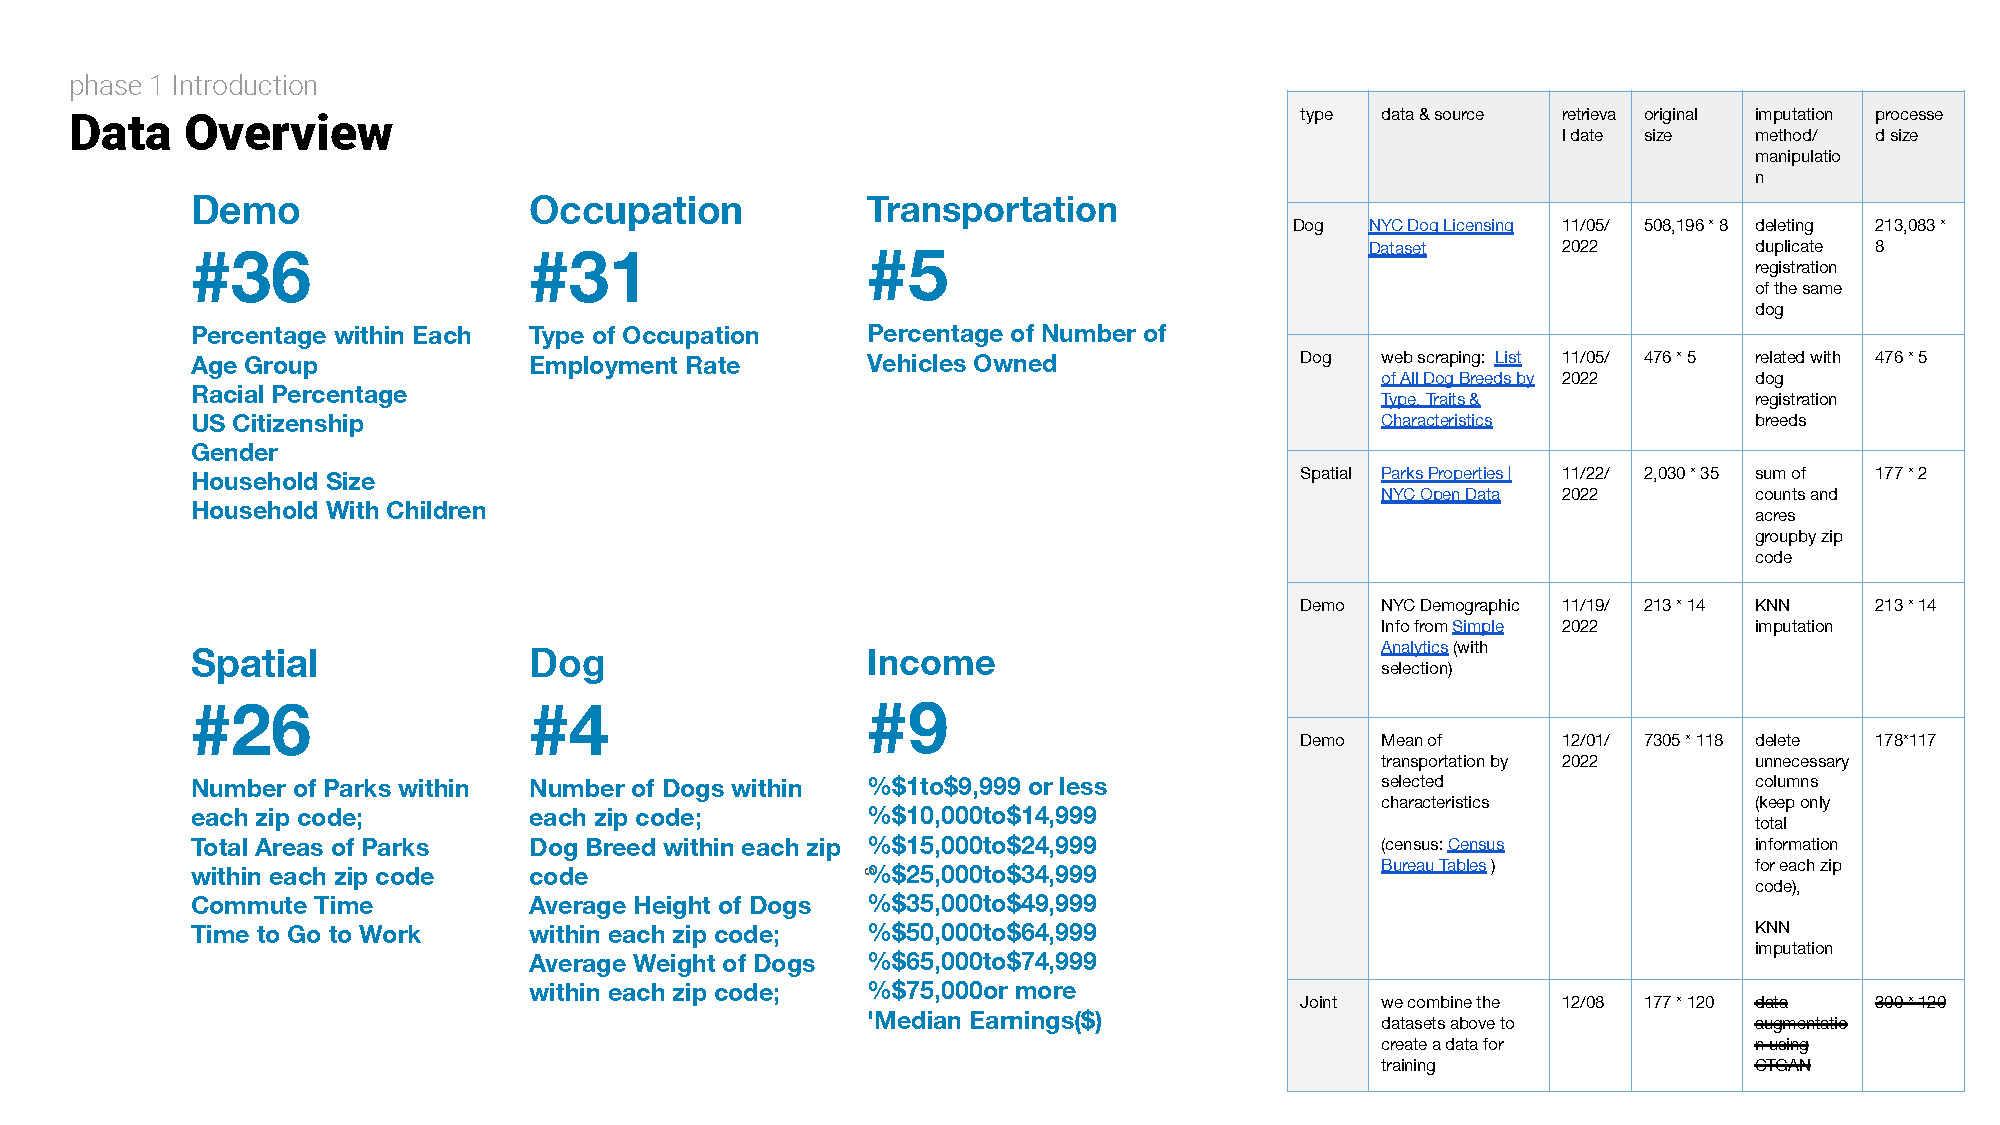
Our project is motivated by the prevalence of certain dog breeds in various neighborhoods in Cambridge and Boston, and we seek to explore the correlation between dogs and socioeconomic factors such as income, work-life balance, household size, and neighborhood quality. While we would ideally like to examine individual dog and owner characteristics, ethical data inquiry practices prevent us from doing so, and data limitations make it impractical. Instead, we will use zip code as a common feature in our data collection and analysis. To conduct our investigation, we have chosen New York City as our research site due to the availability of comprehensive data on dogs, people, and neighborhoods, as well as its socioeconomic stratification and spatial segregation. Additionally, New York City is renowned as a bustling metropolis, making it an ideal location to investigate the relationship between dogs and urban living.
*Launch the site here (click me)

STEP ONE
Background
The project aims to analyze the relationship between social and spatial factors and provide insight into the intangible and physical organization of the city through the perspective of dogs and their daily routines. It will explore socio-economic indicators such as property values, neighborhood quality, proximity to open spaces like parks, and walkability of the urban environment to visualize the city's spatial characteristics.


STEP TWO
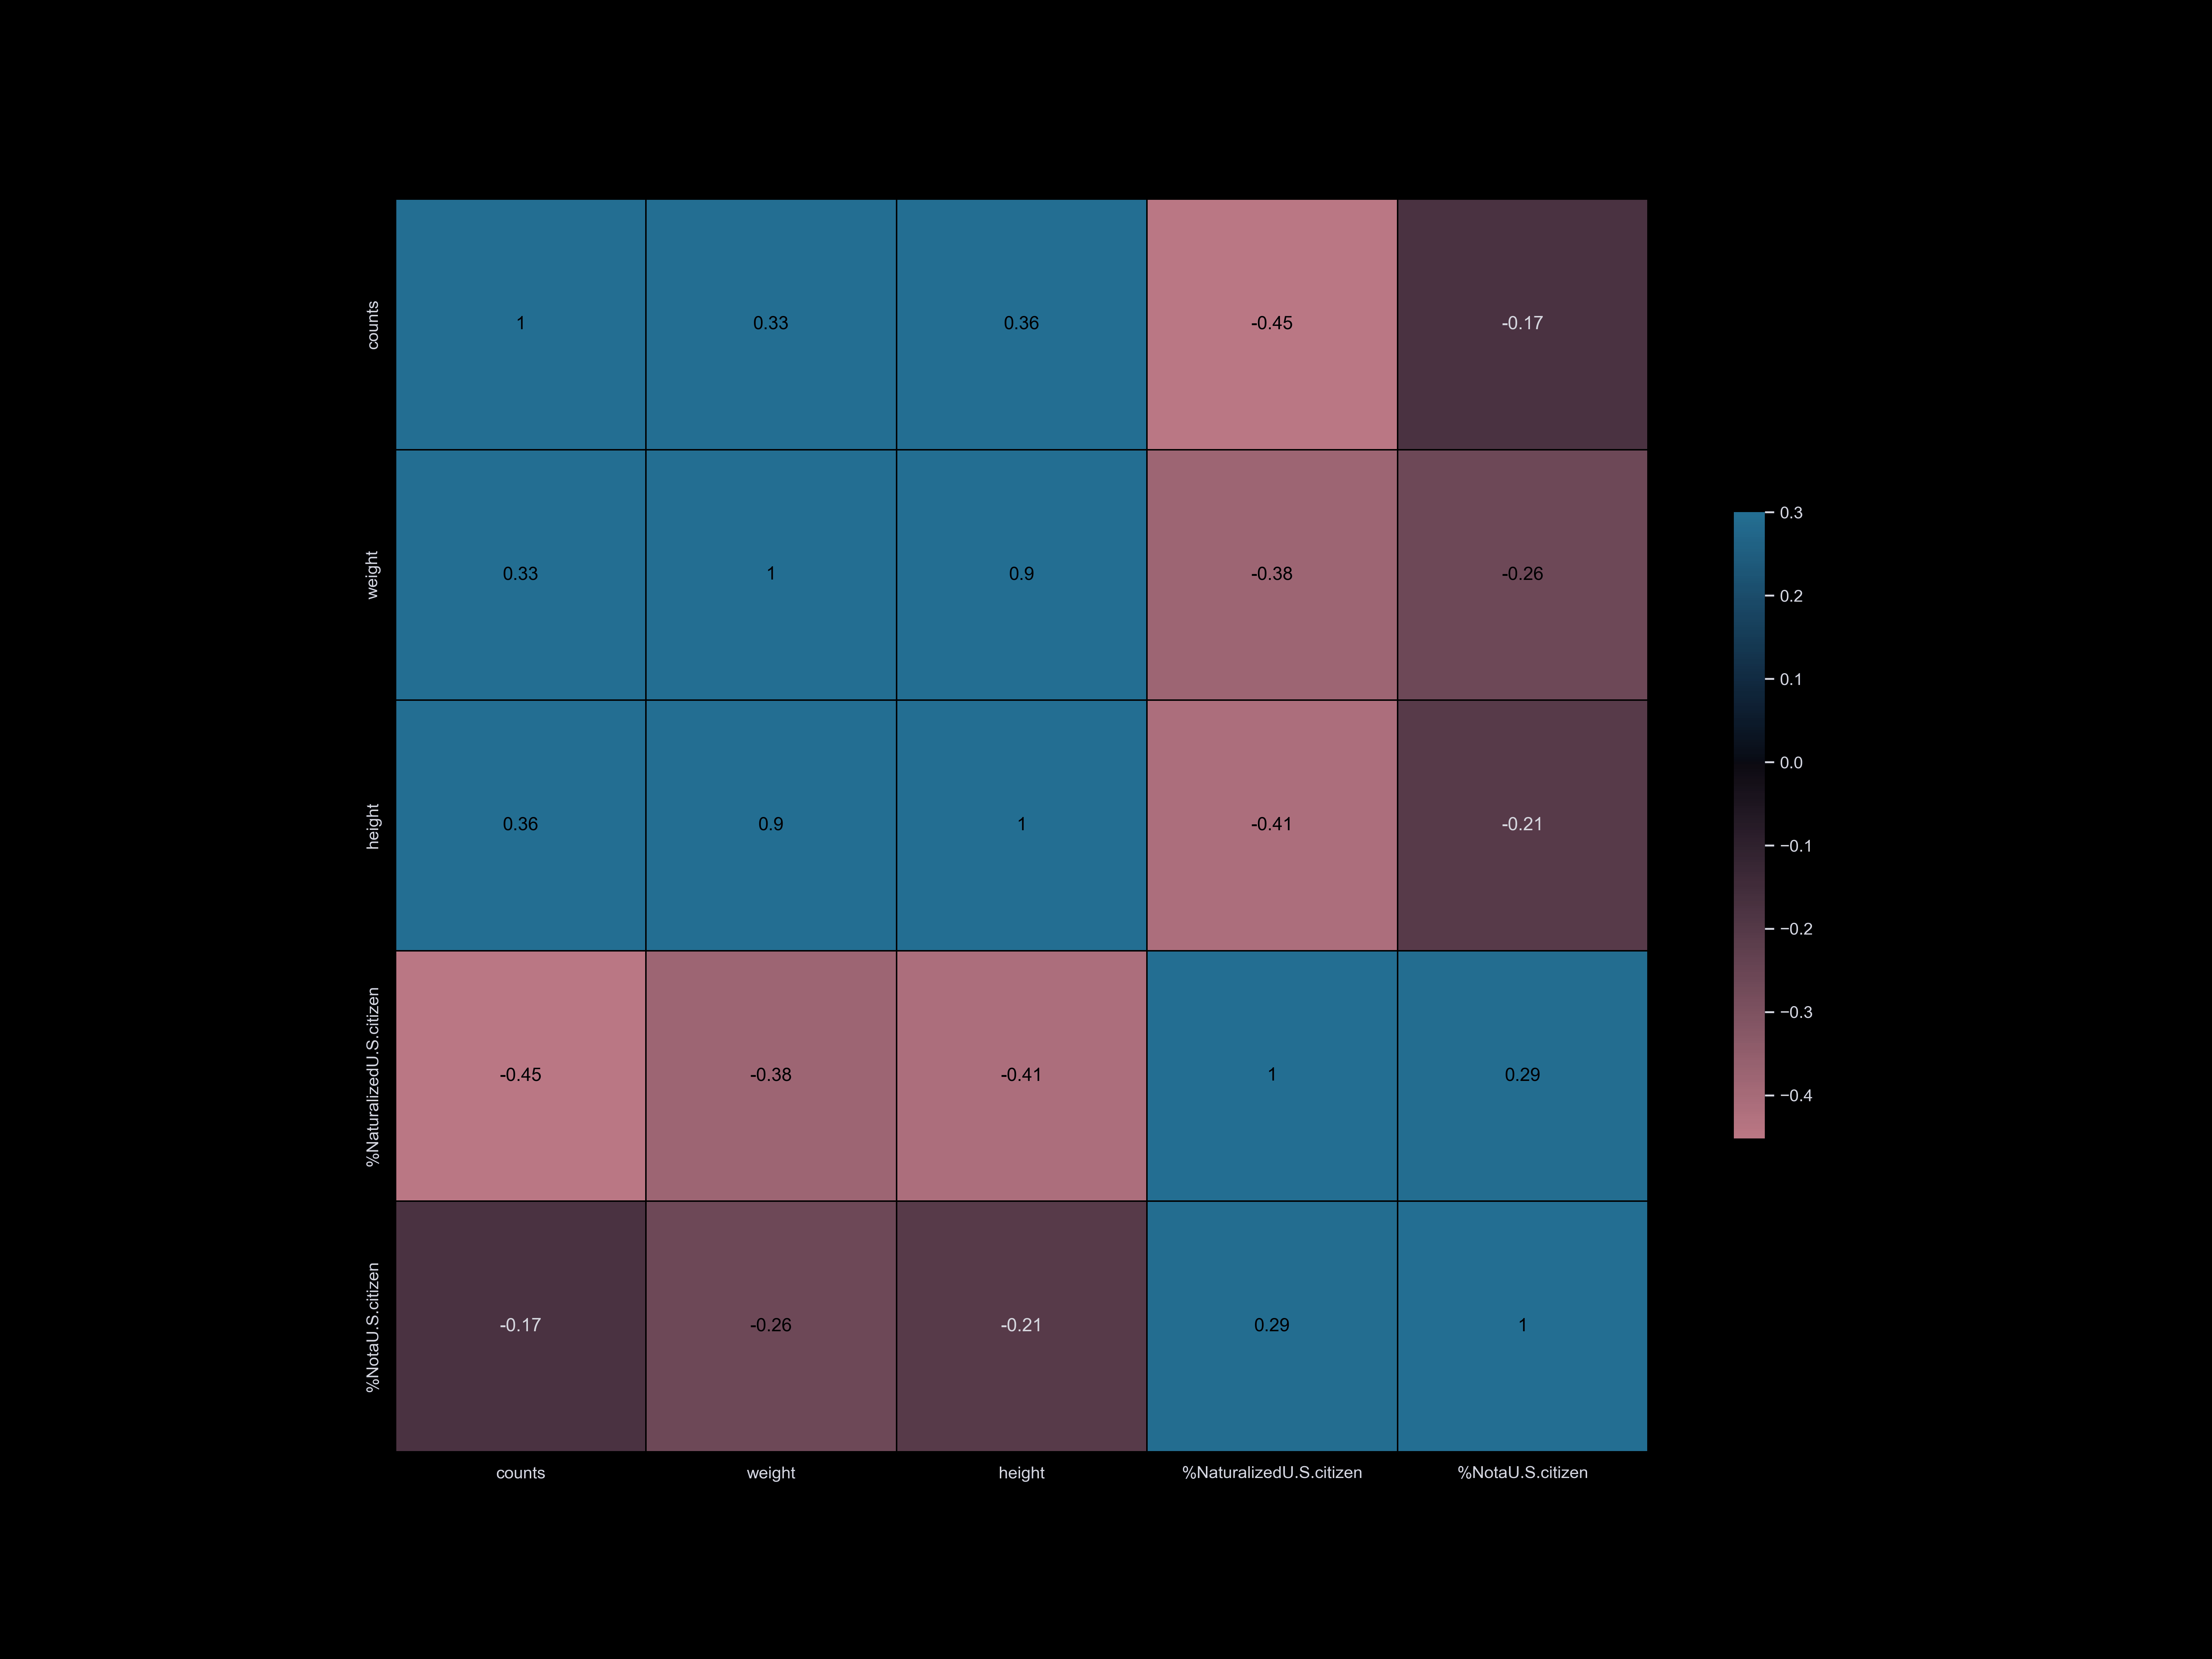
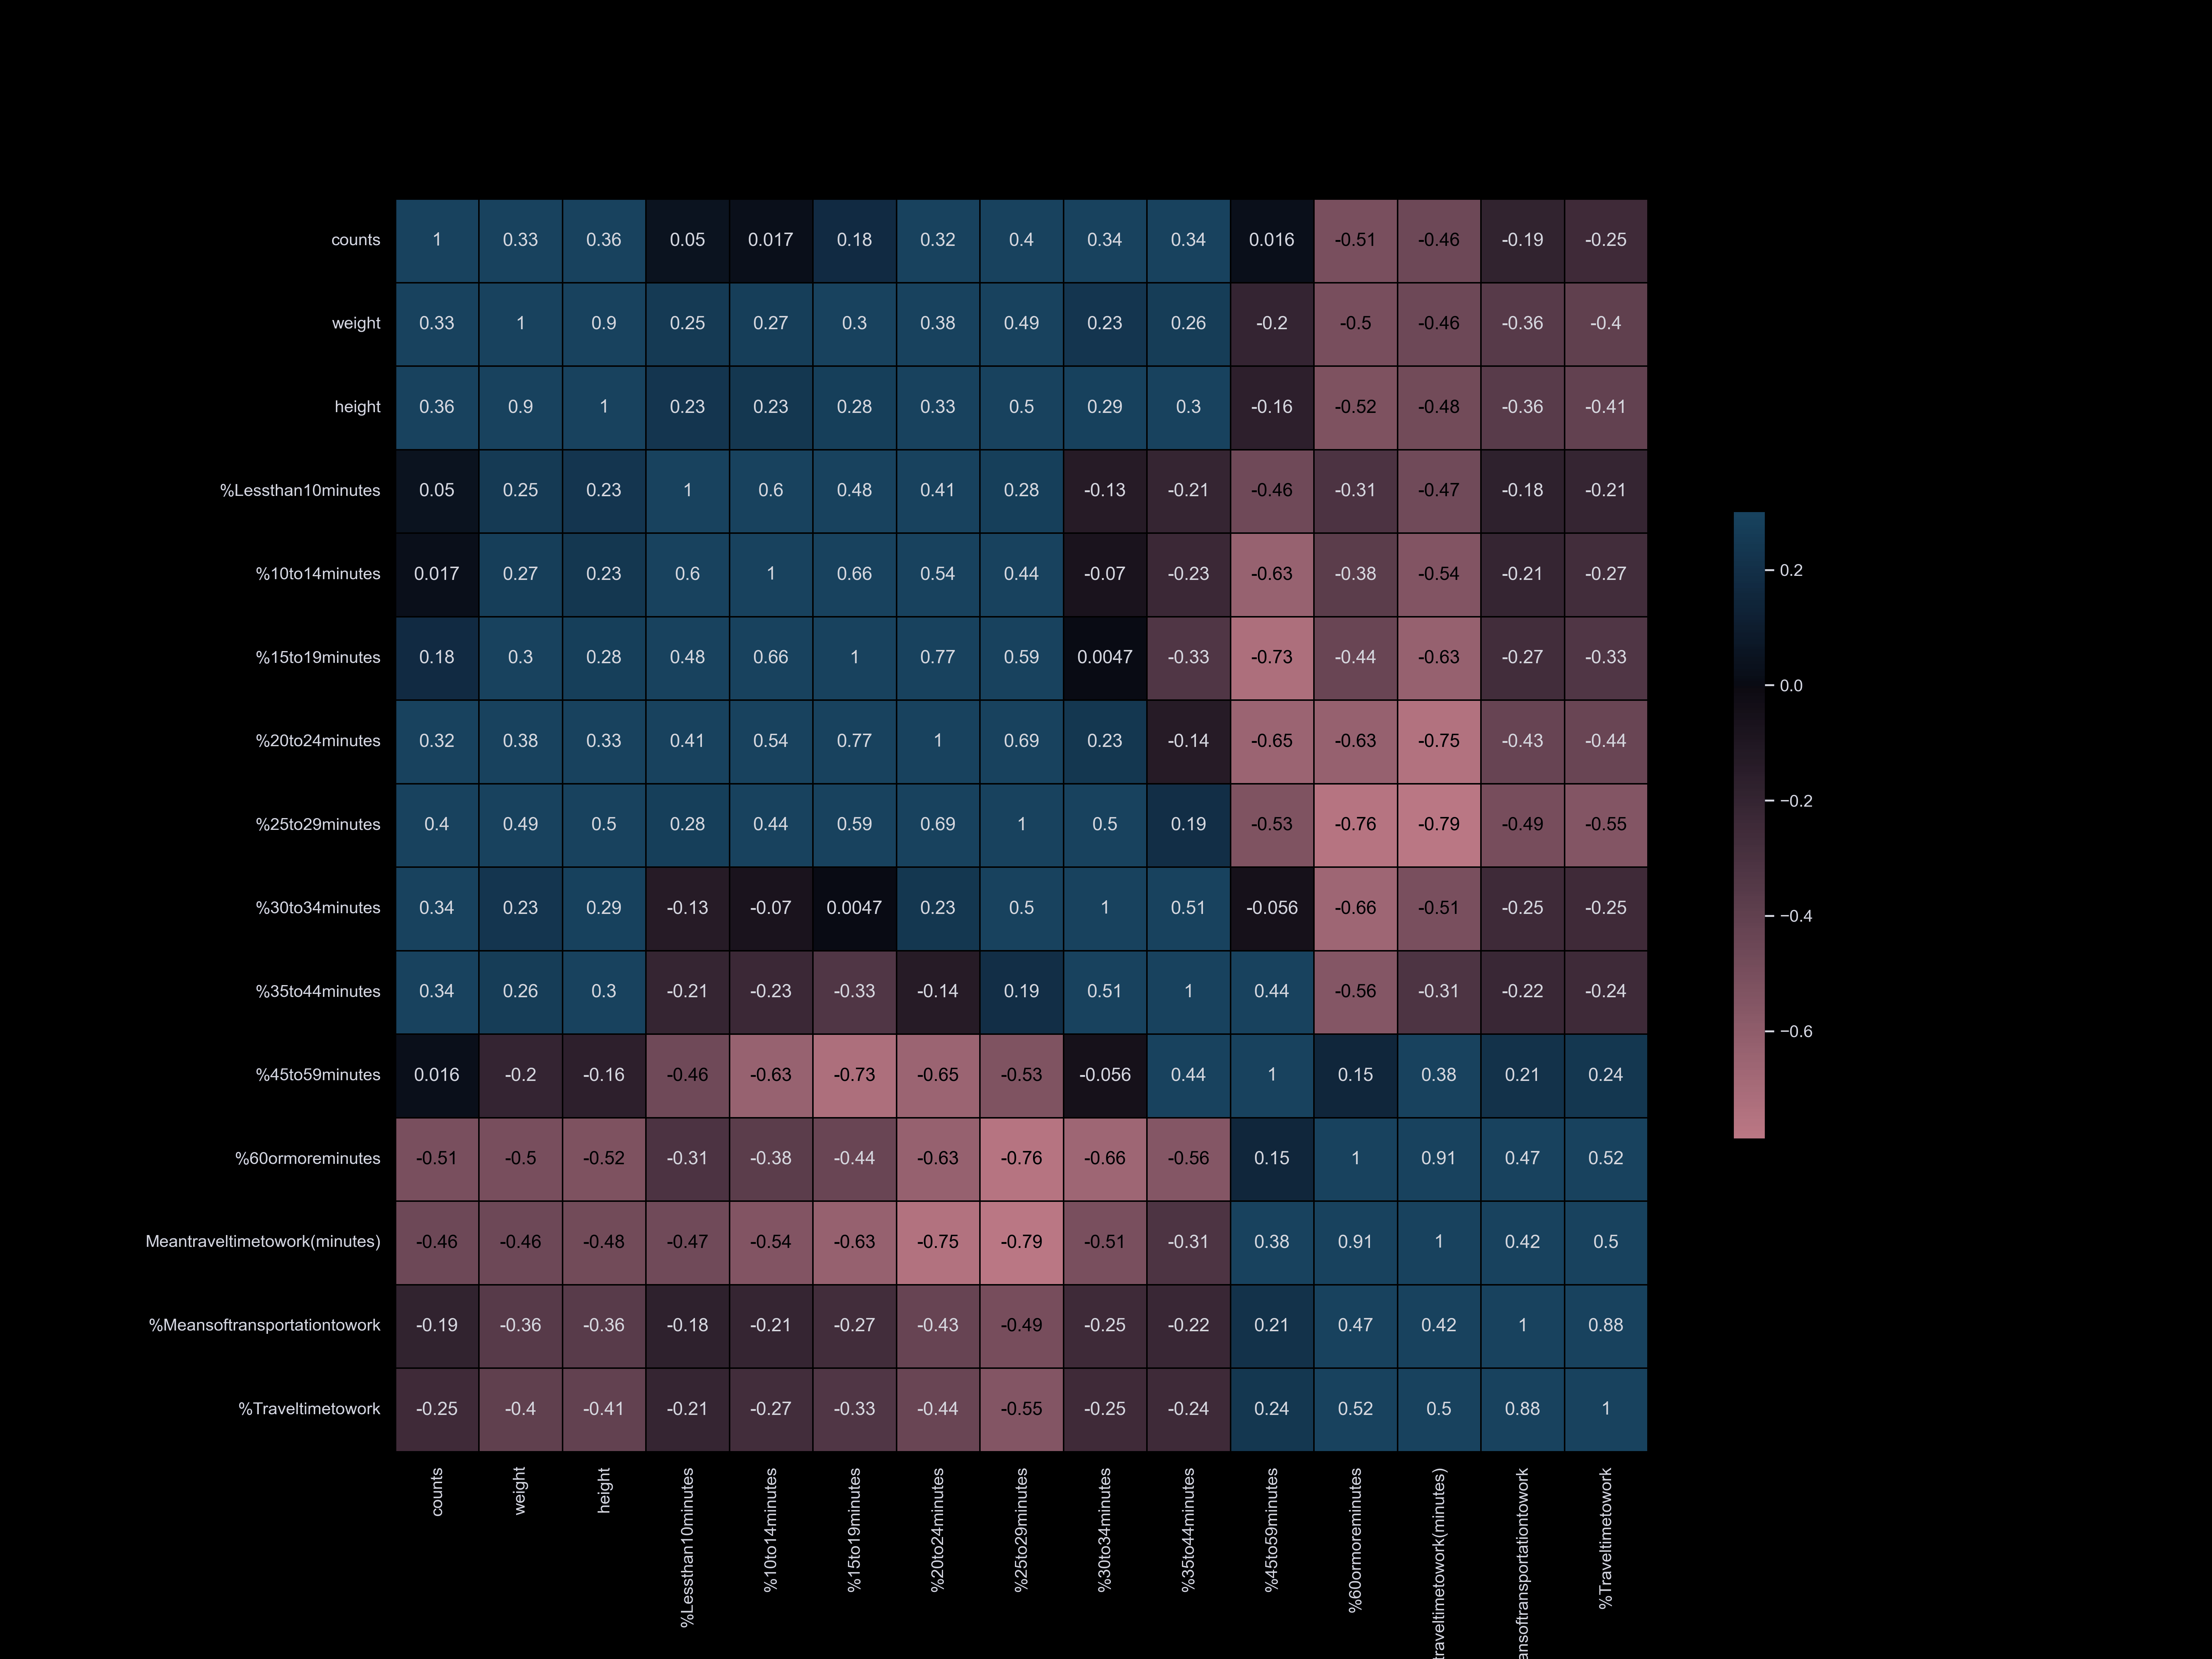
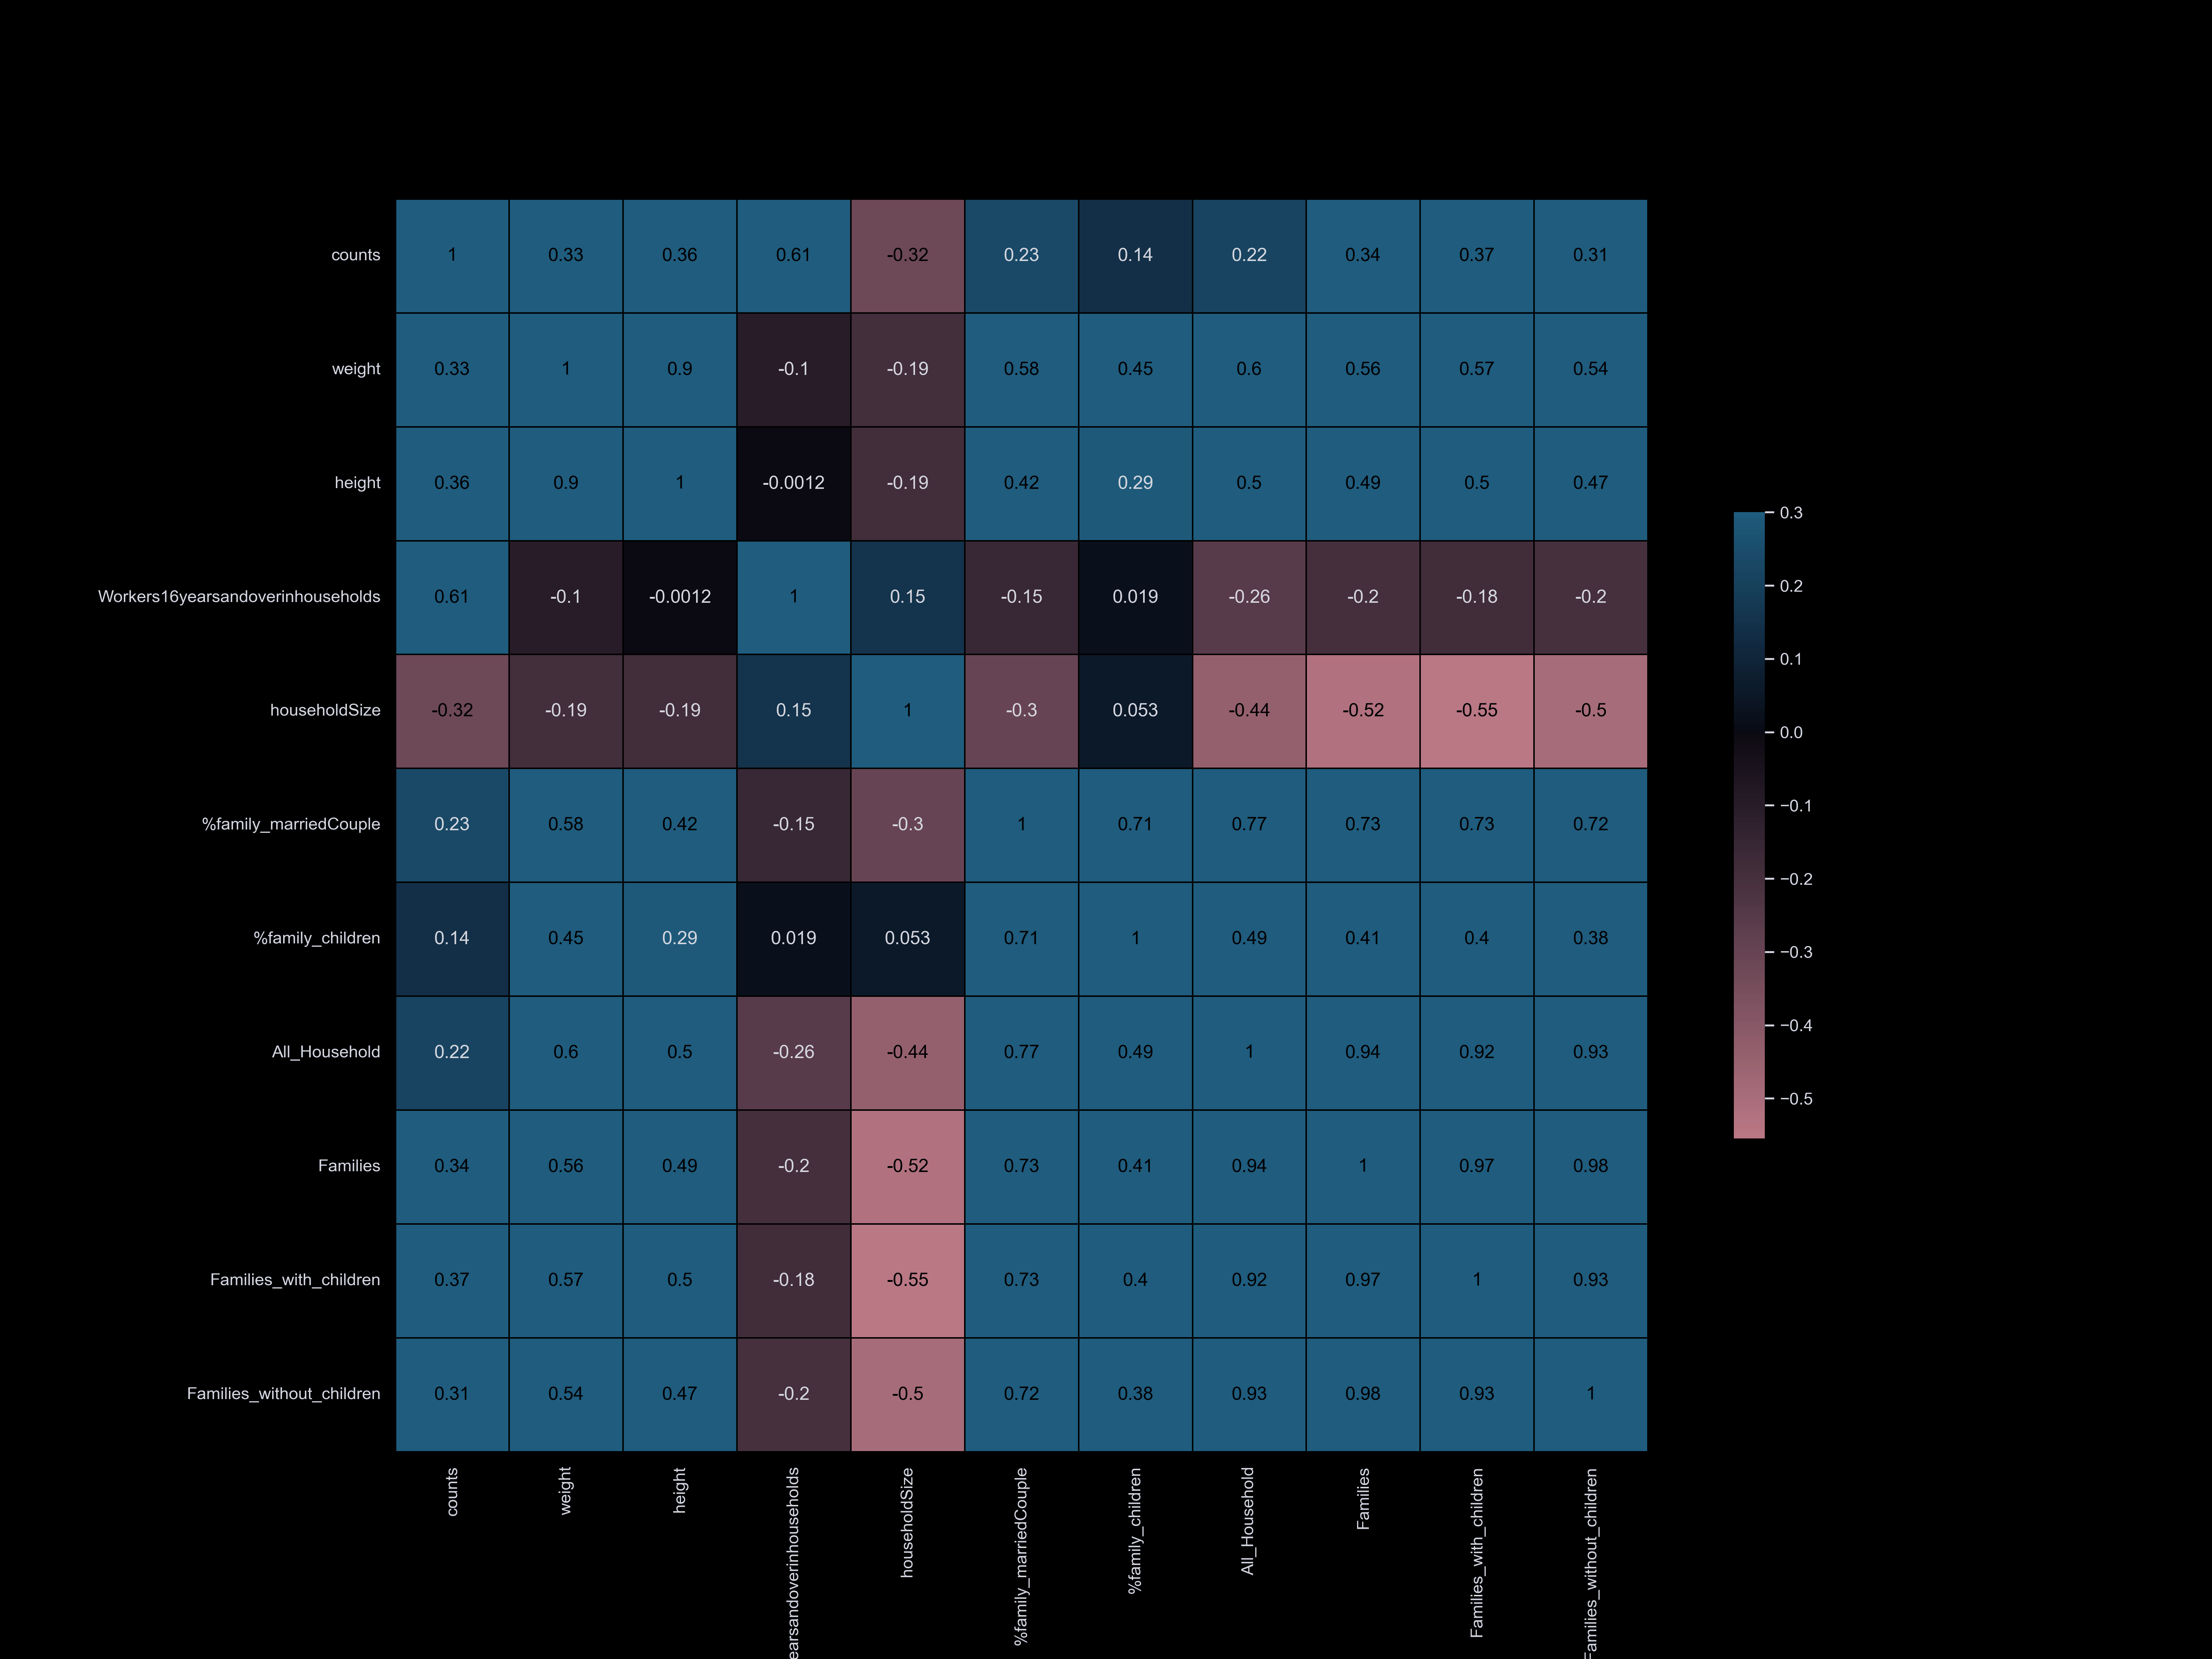
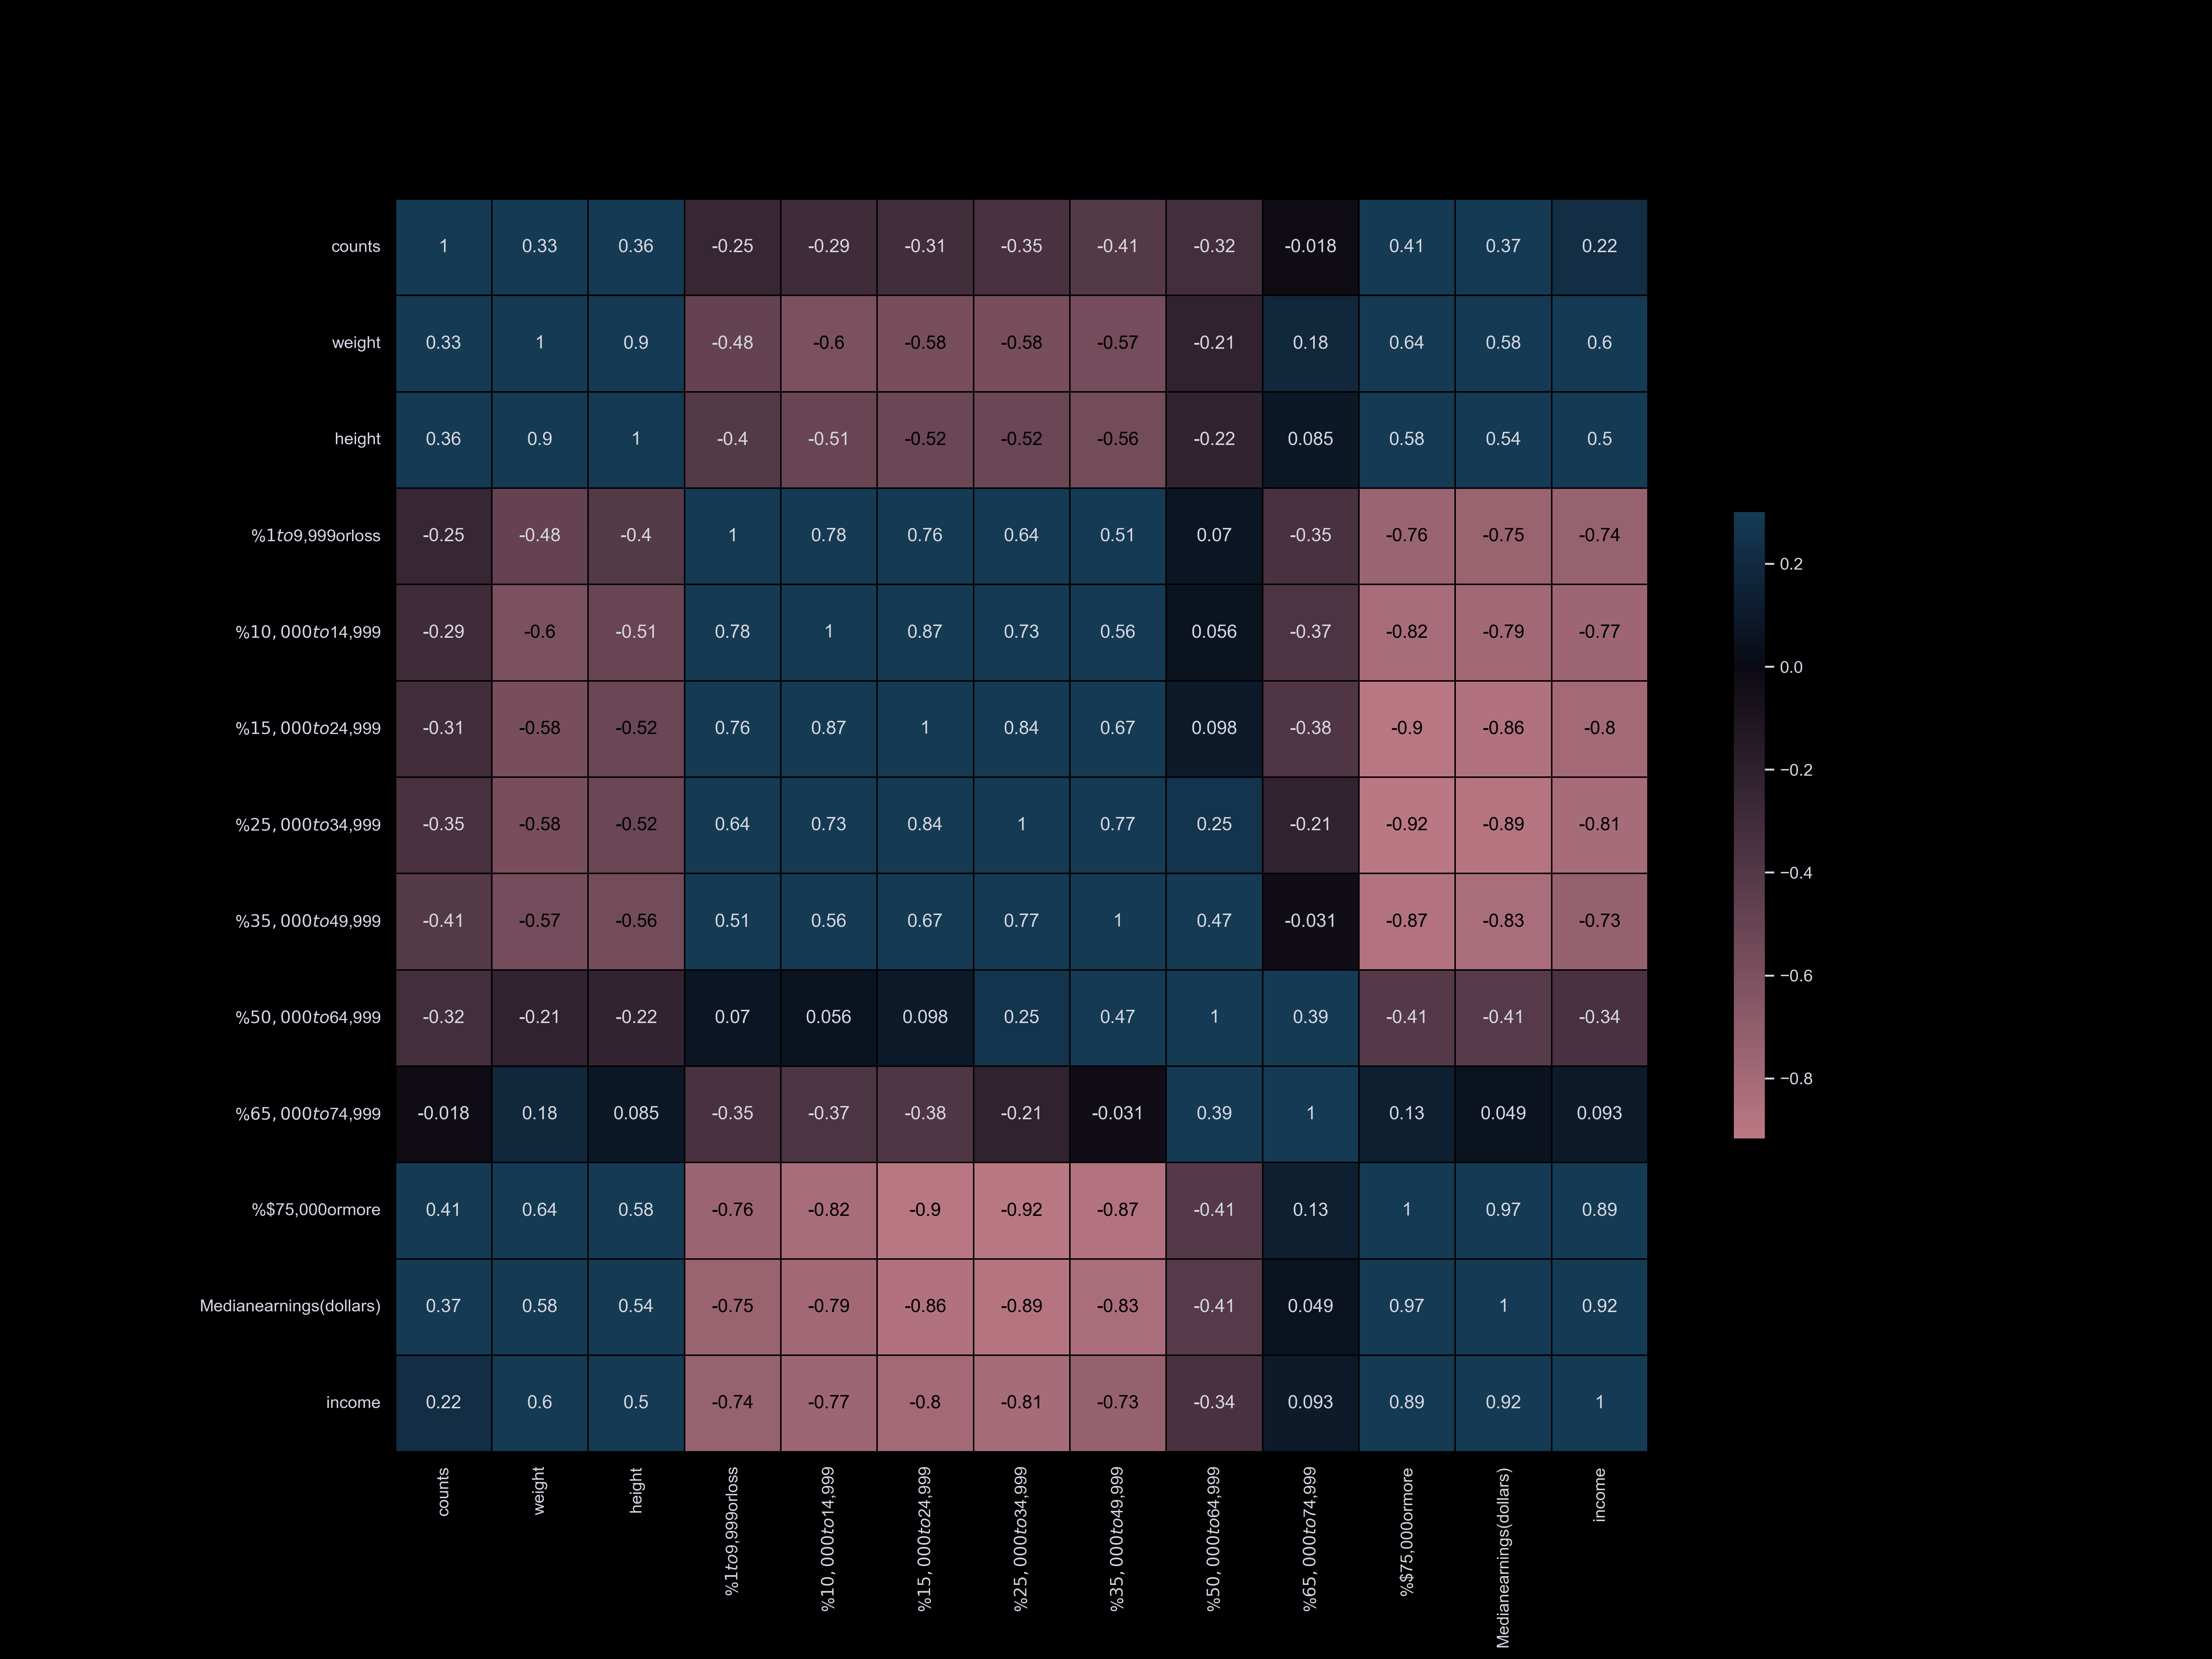
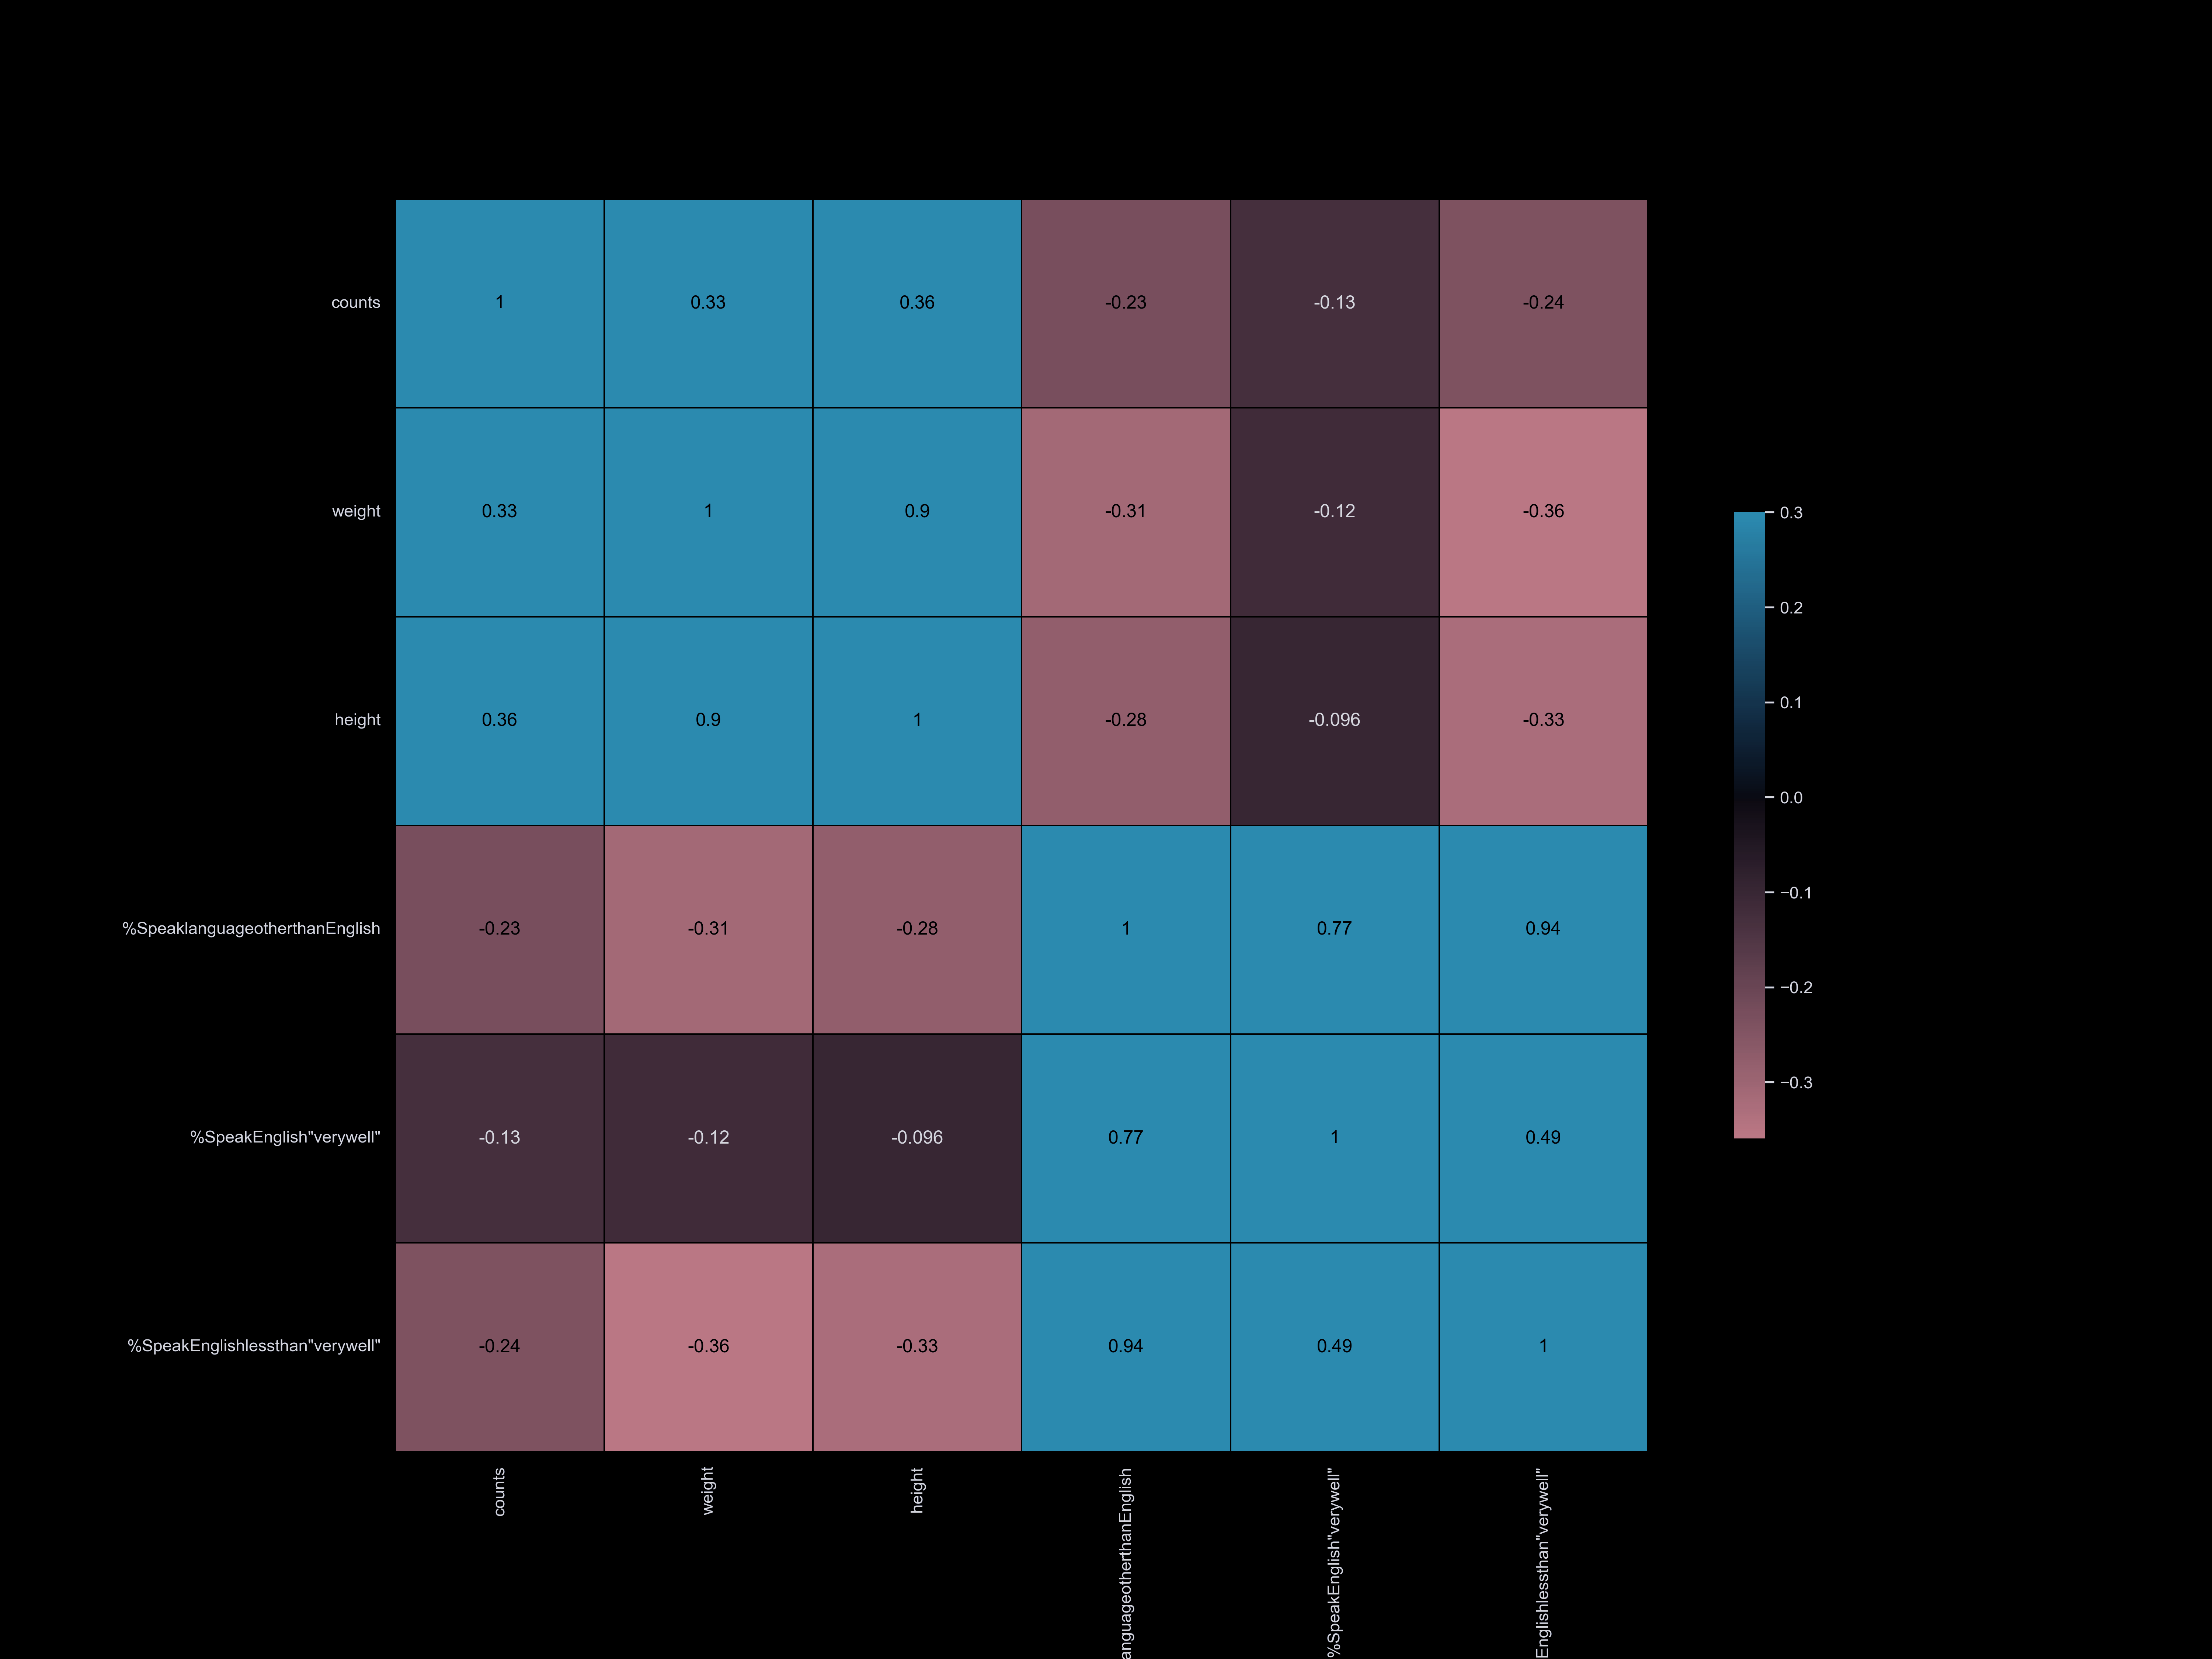
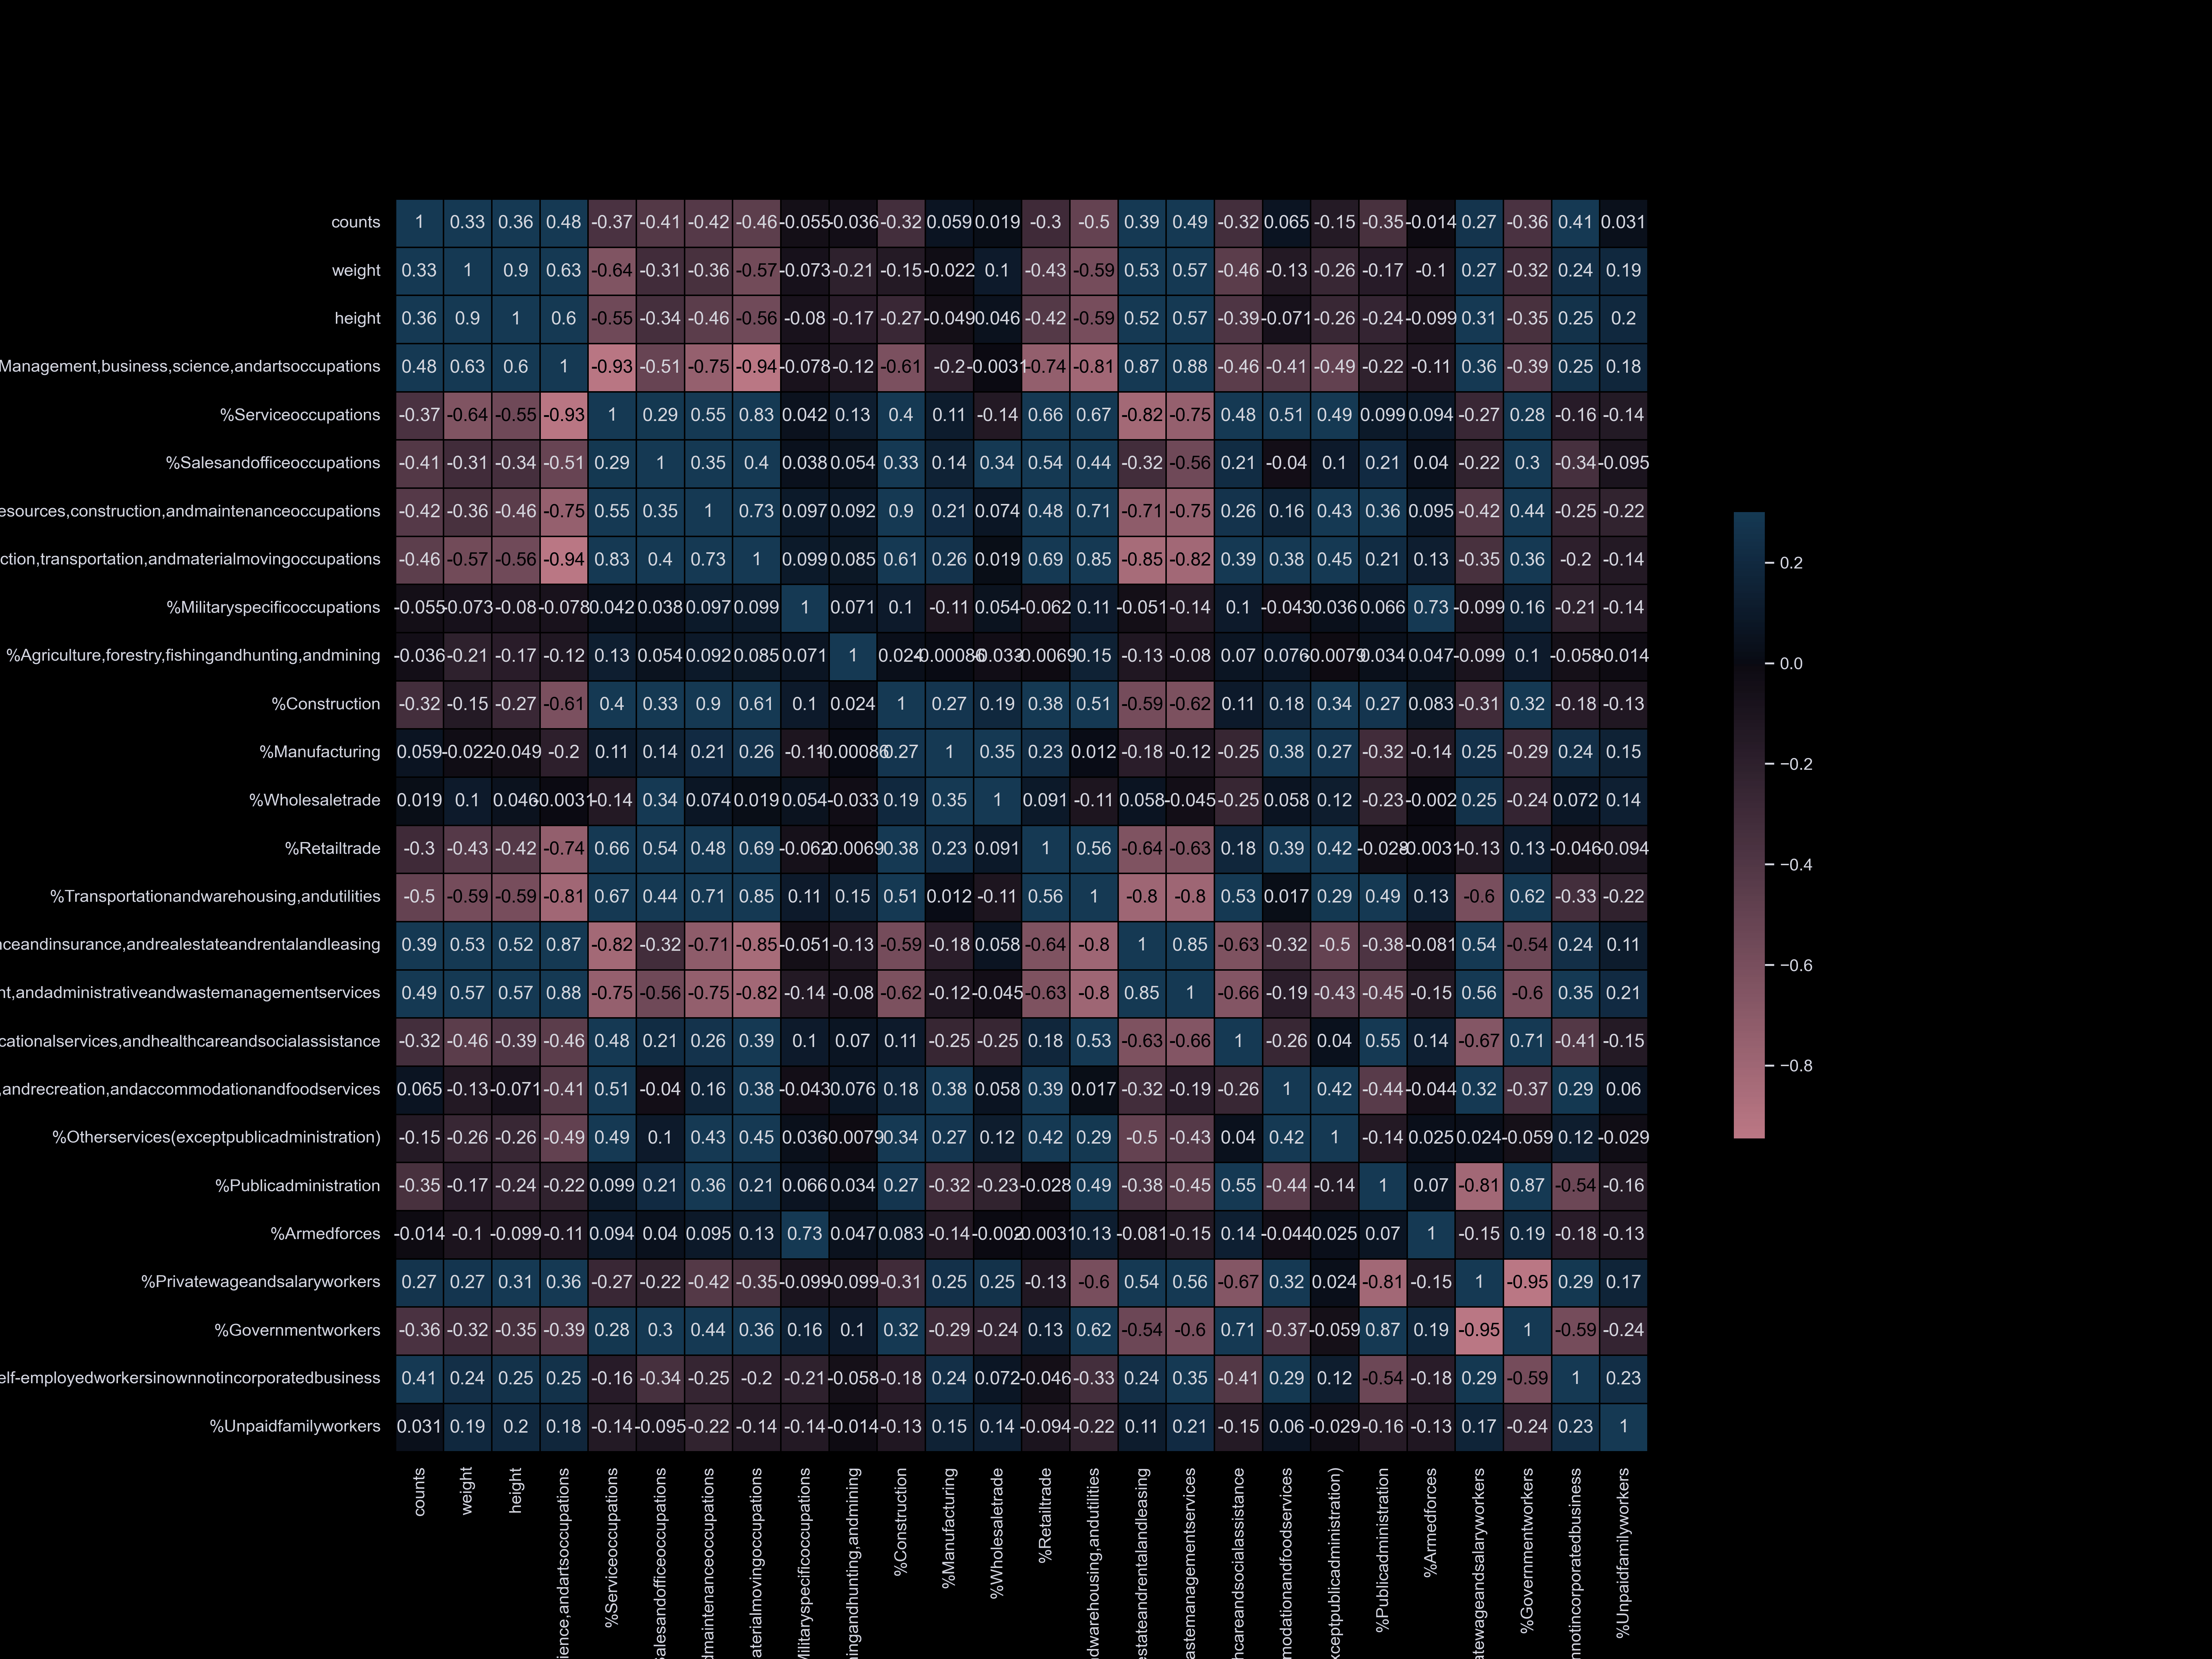
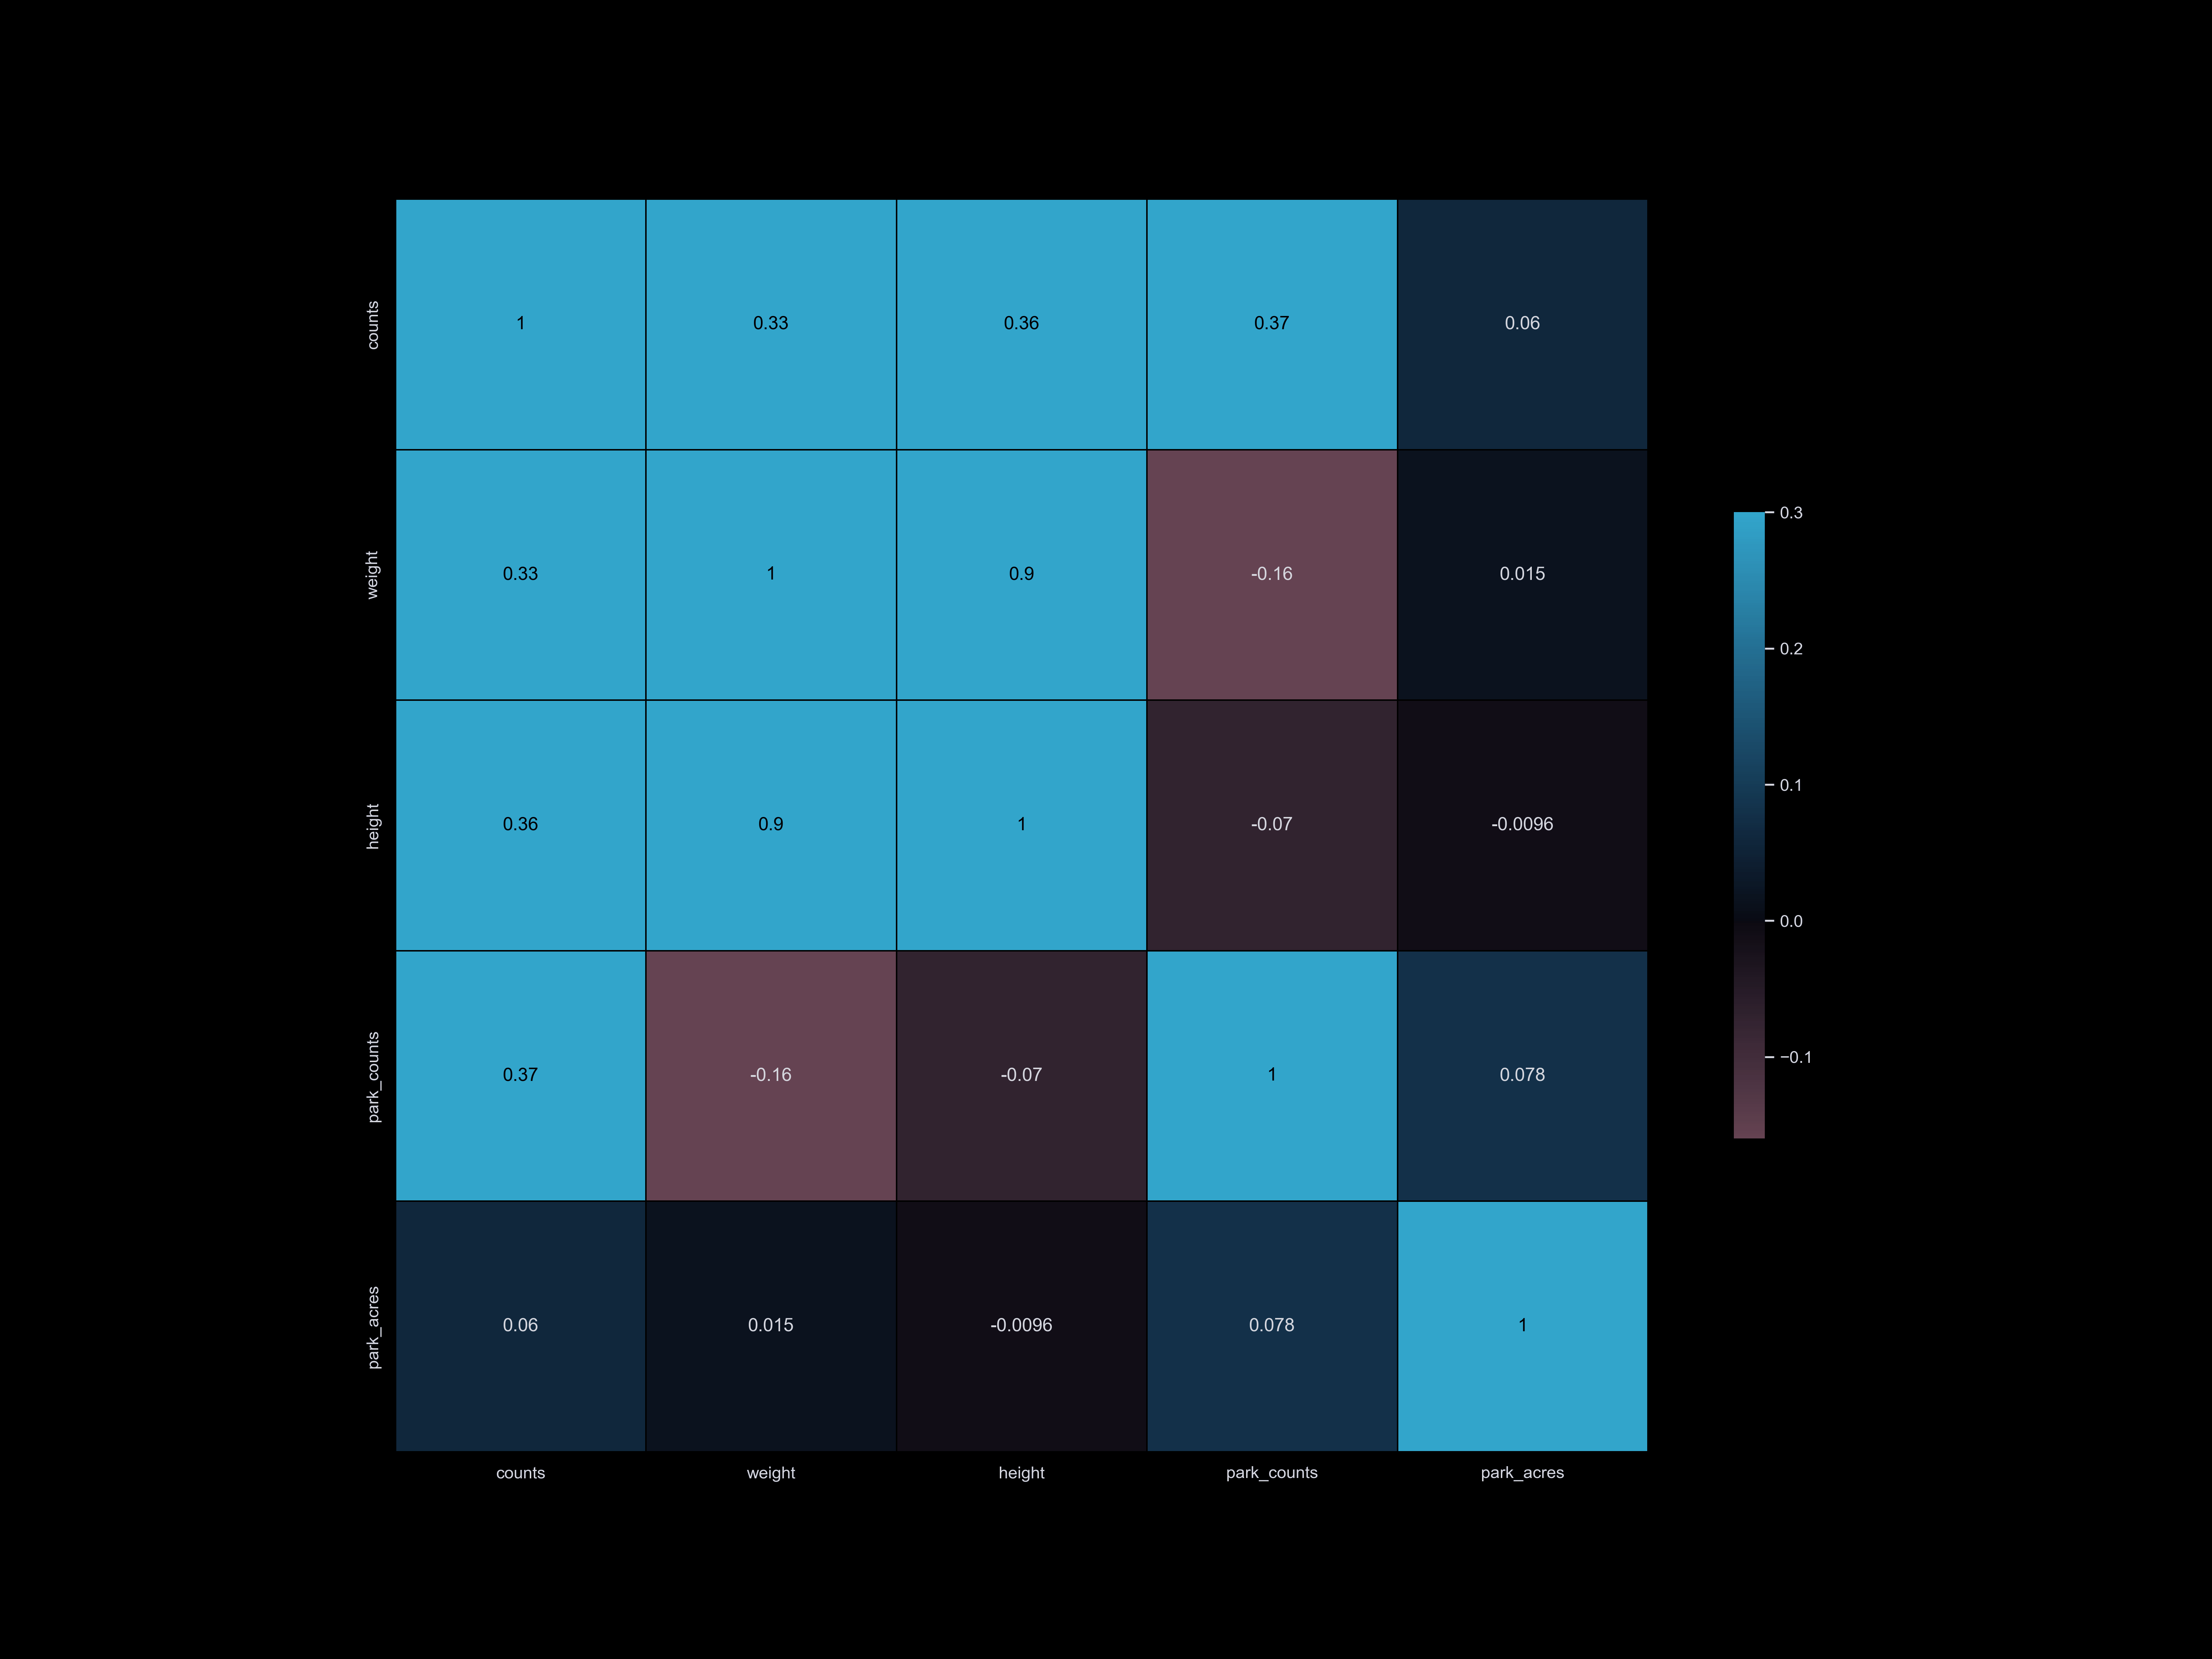
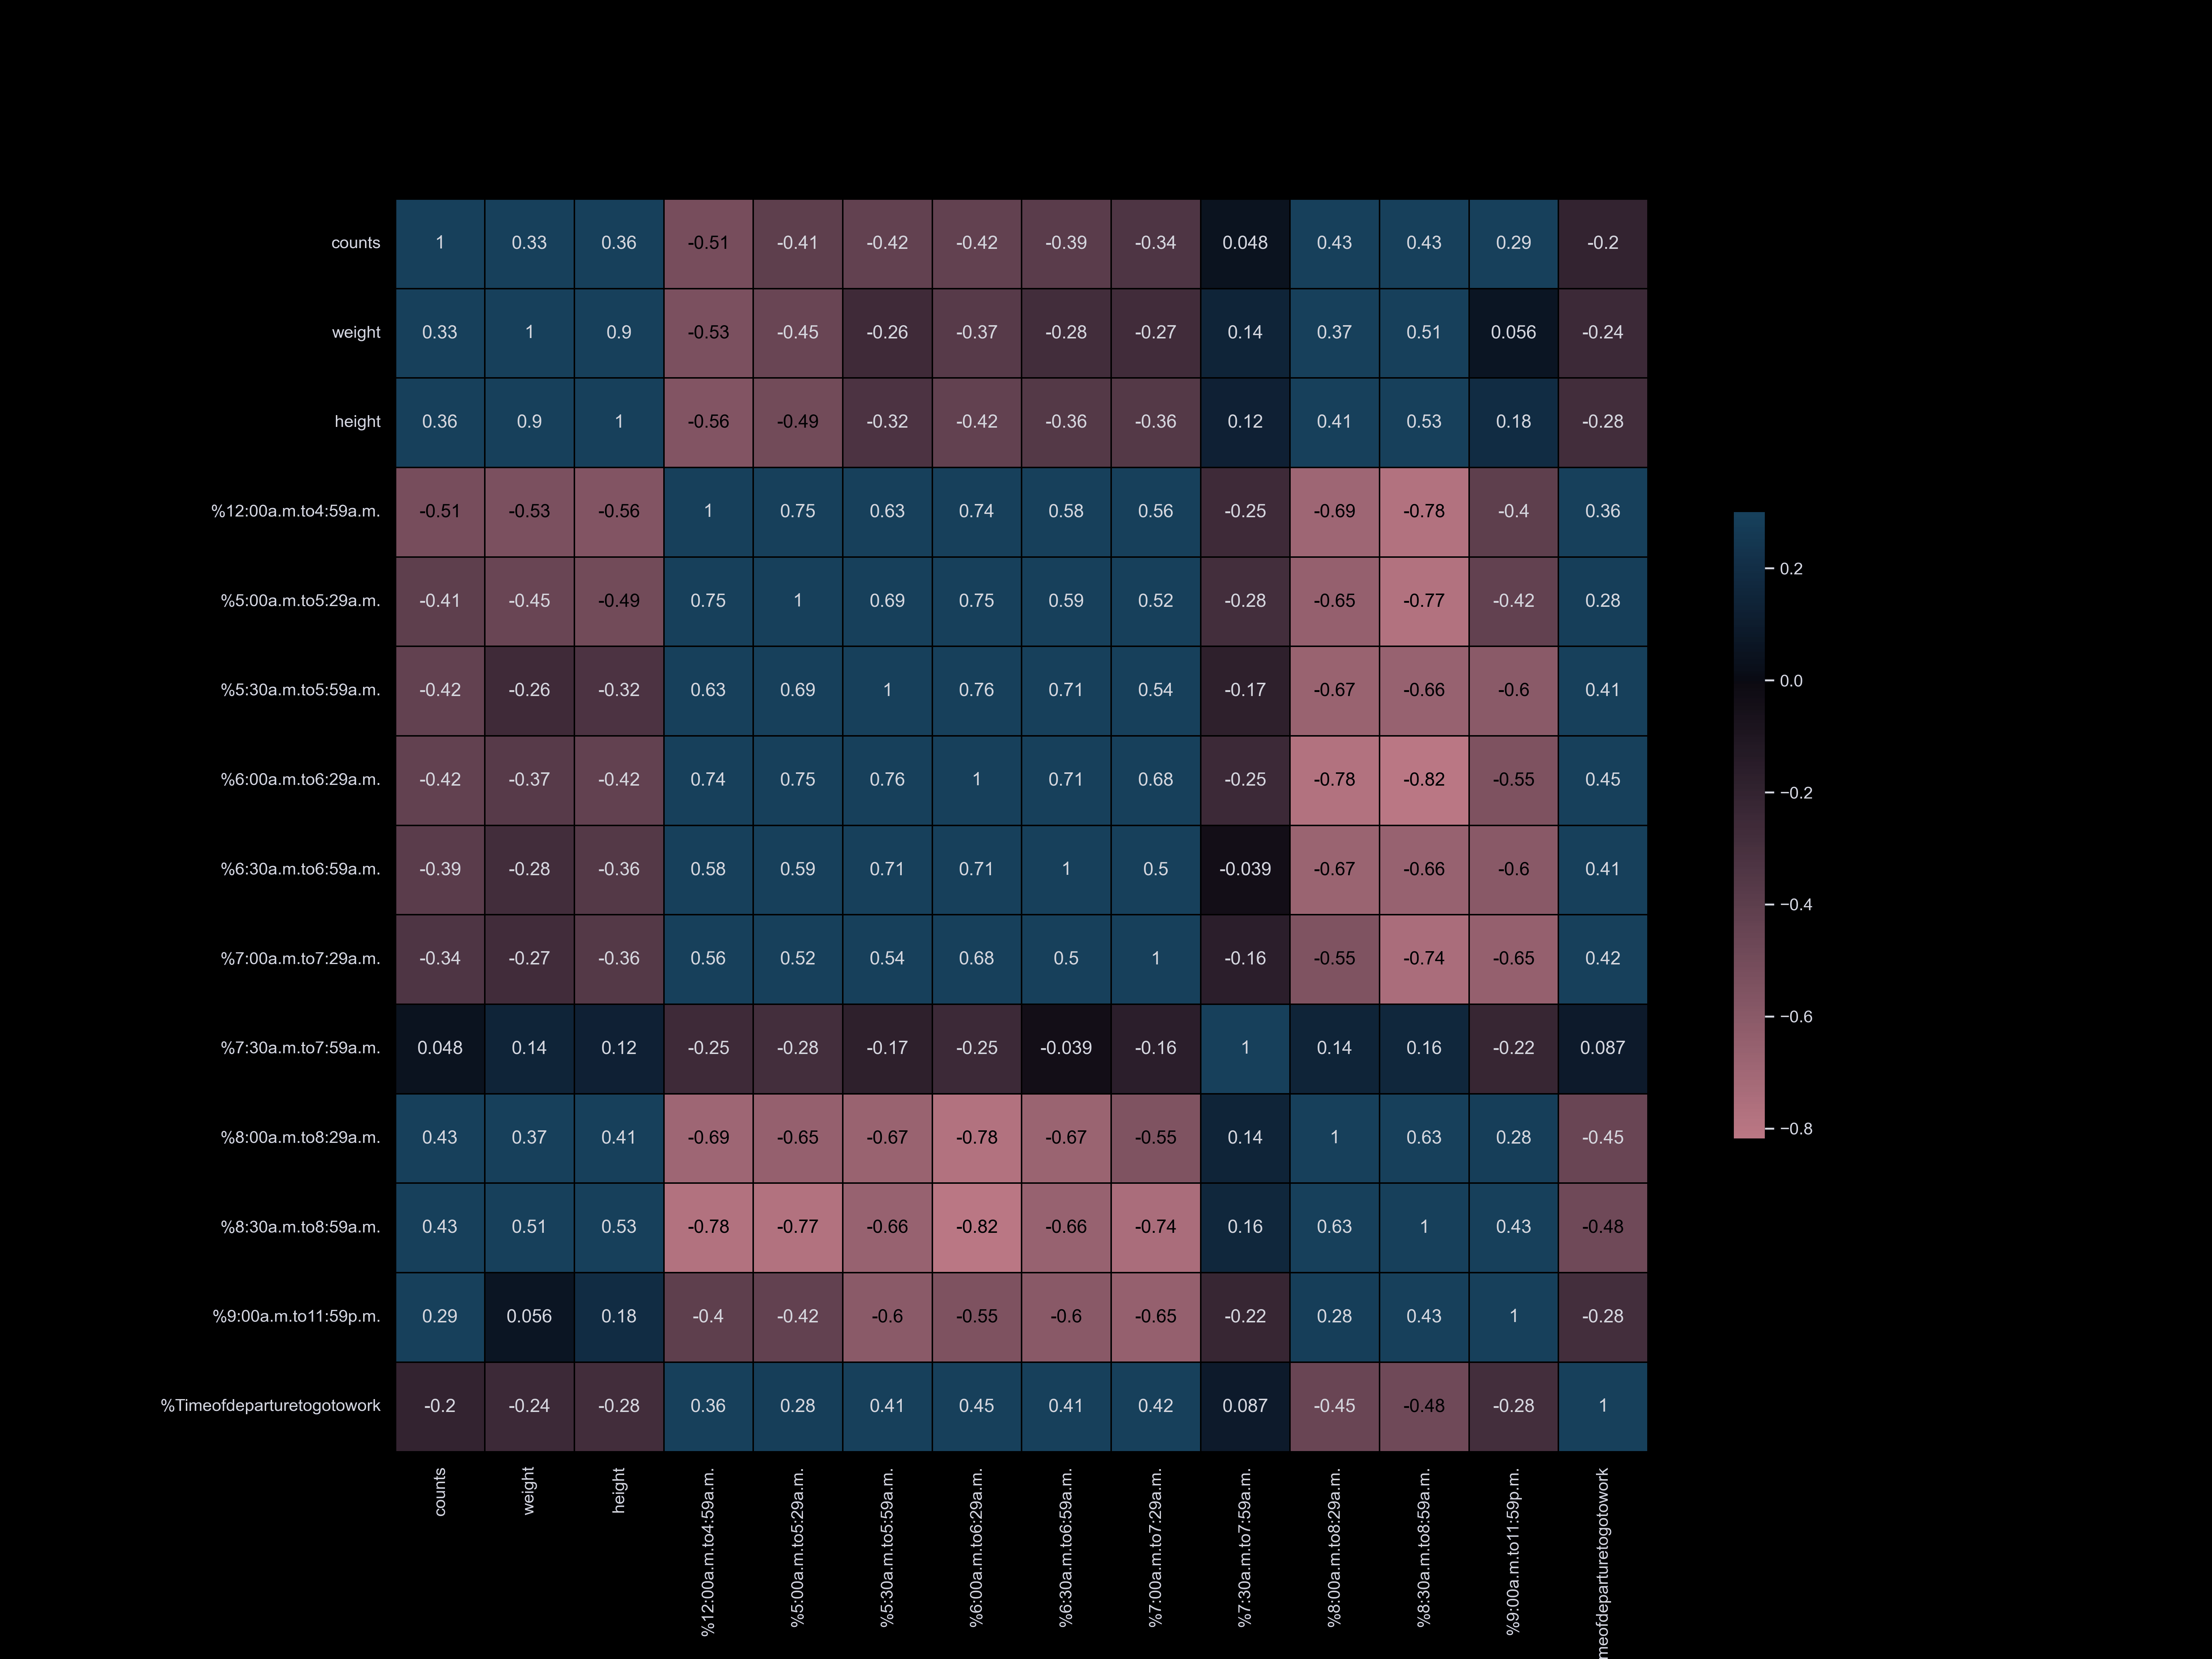
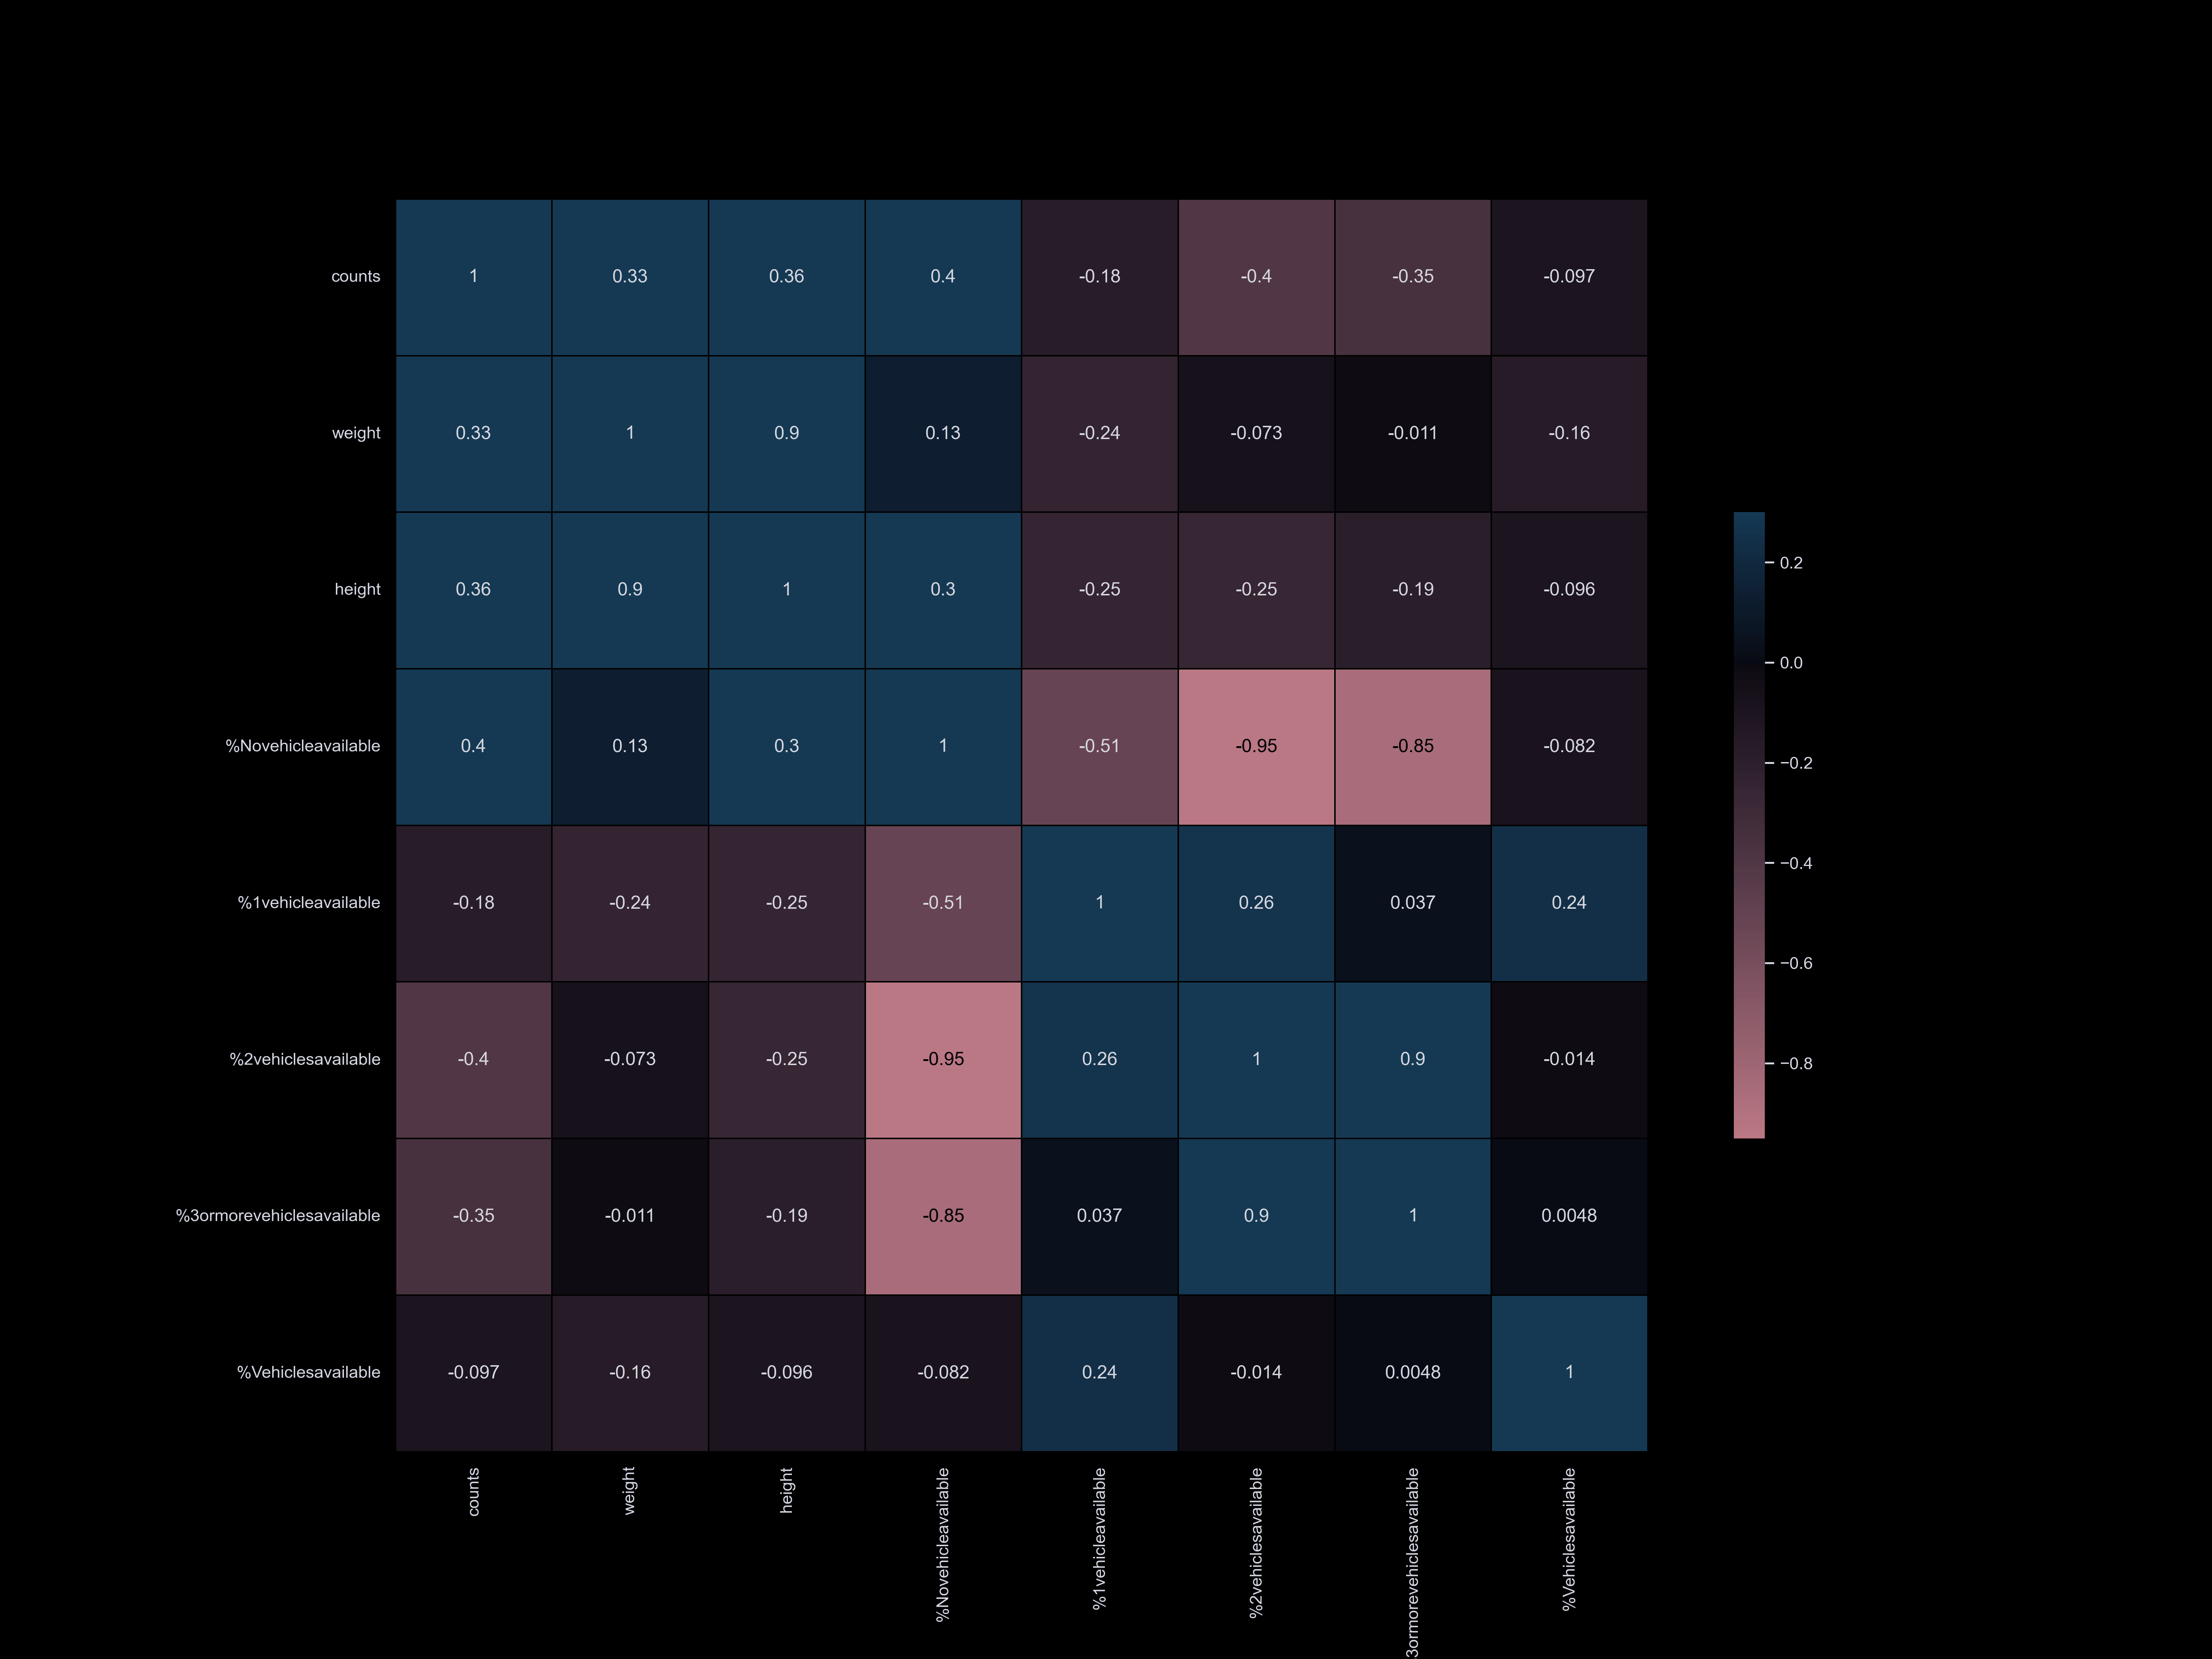
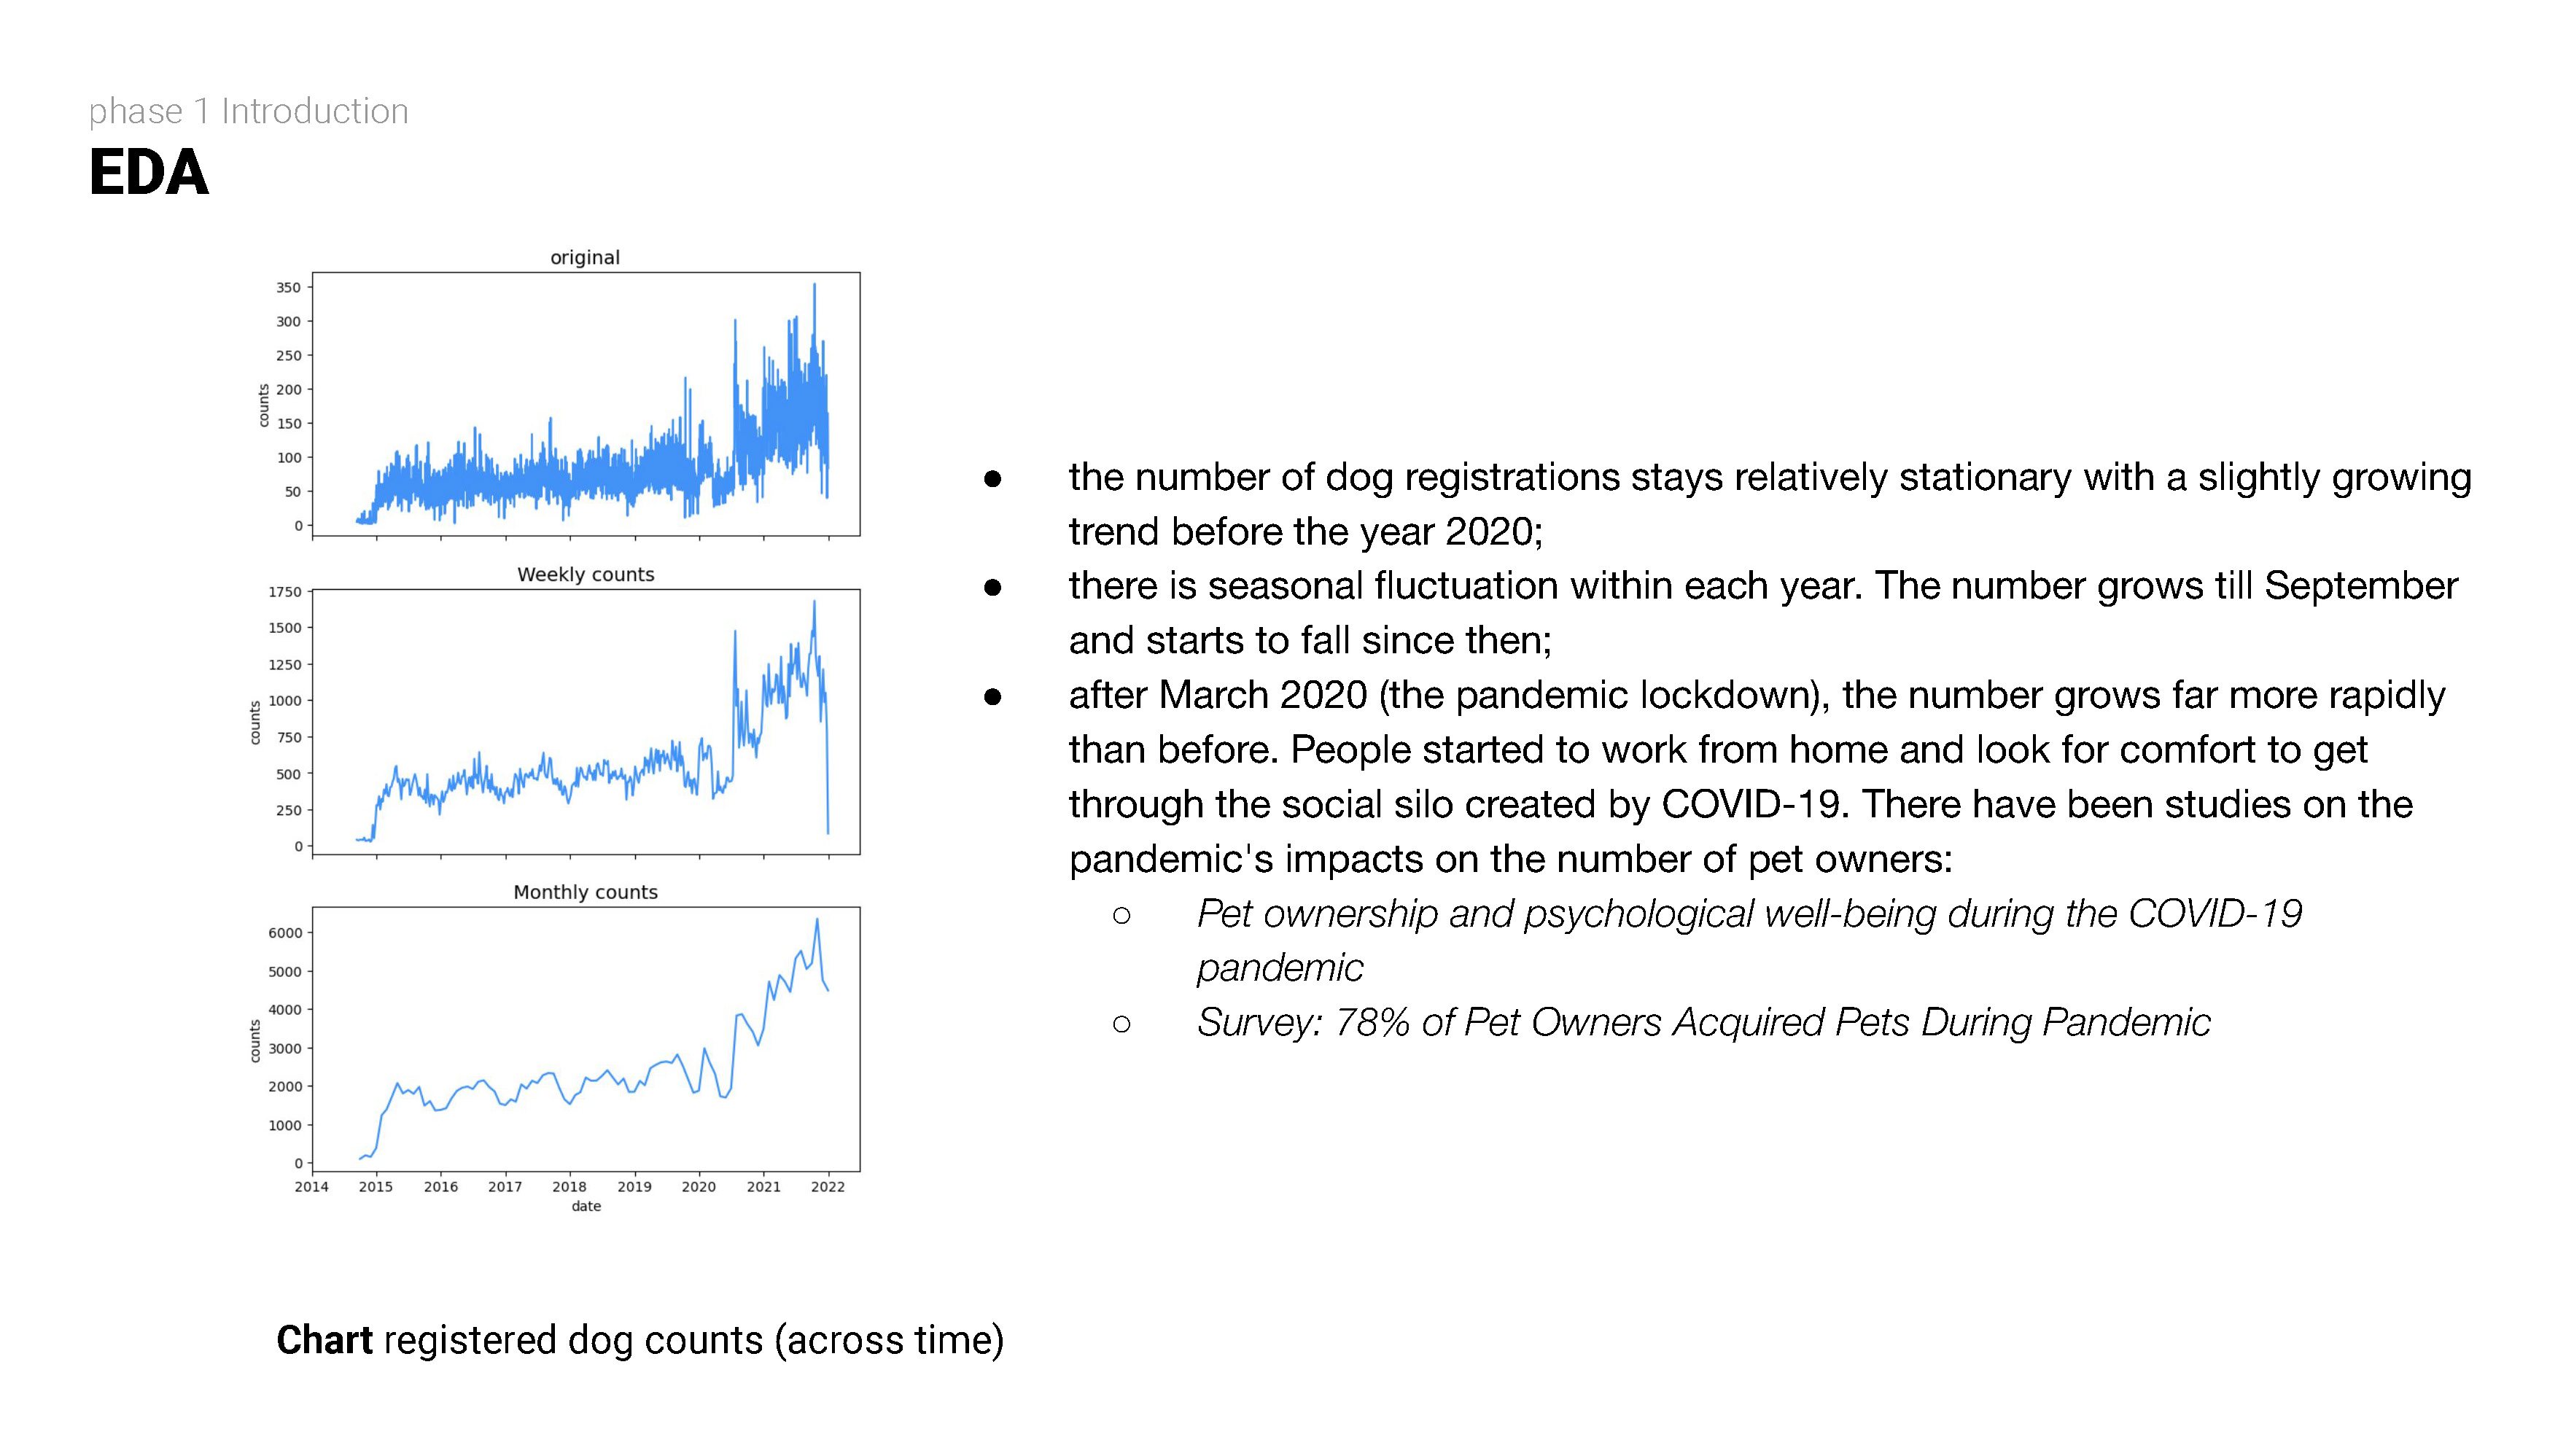
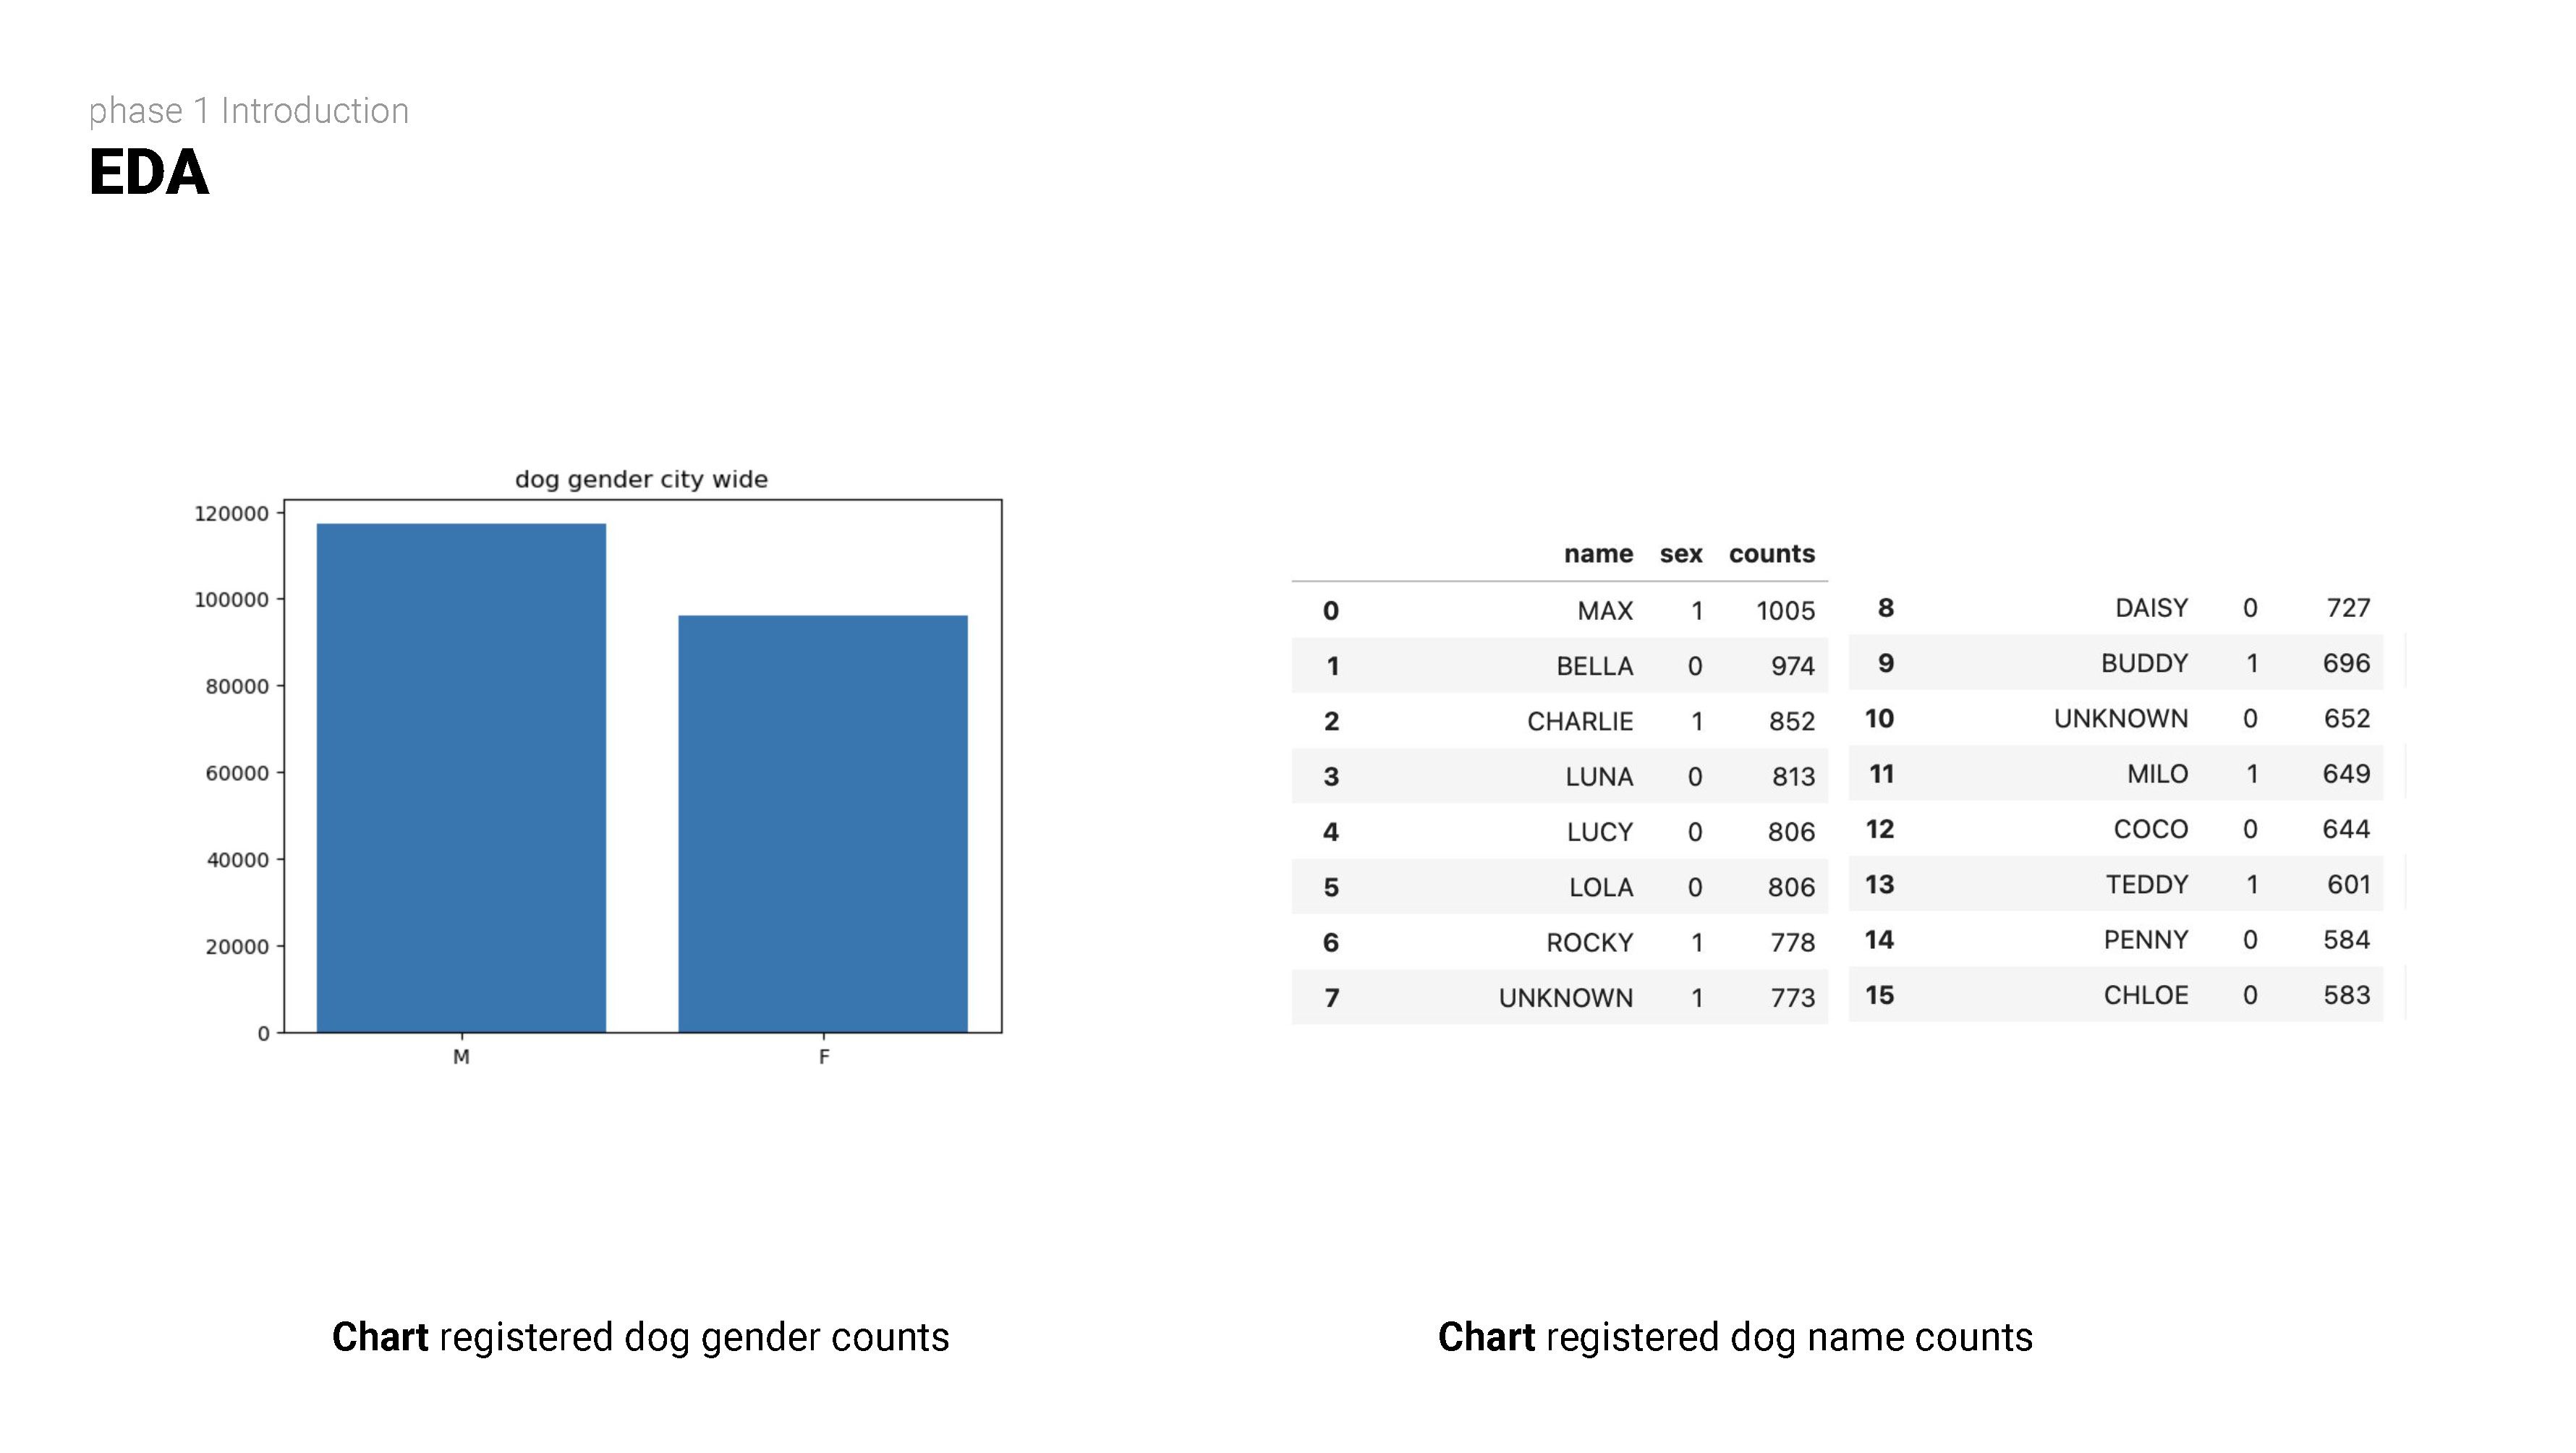
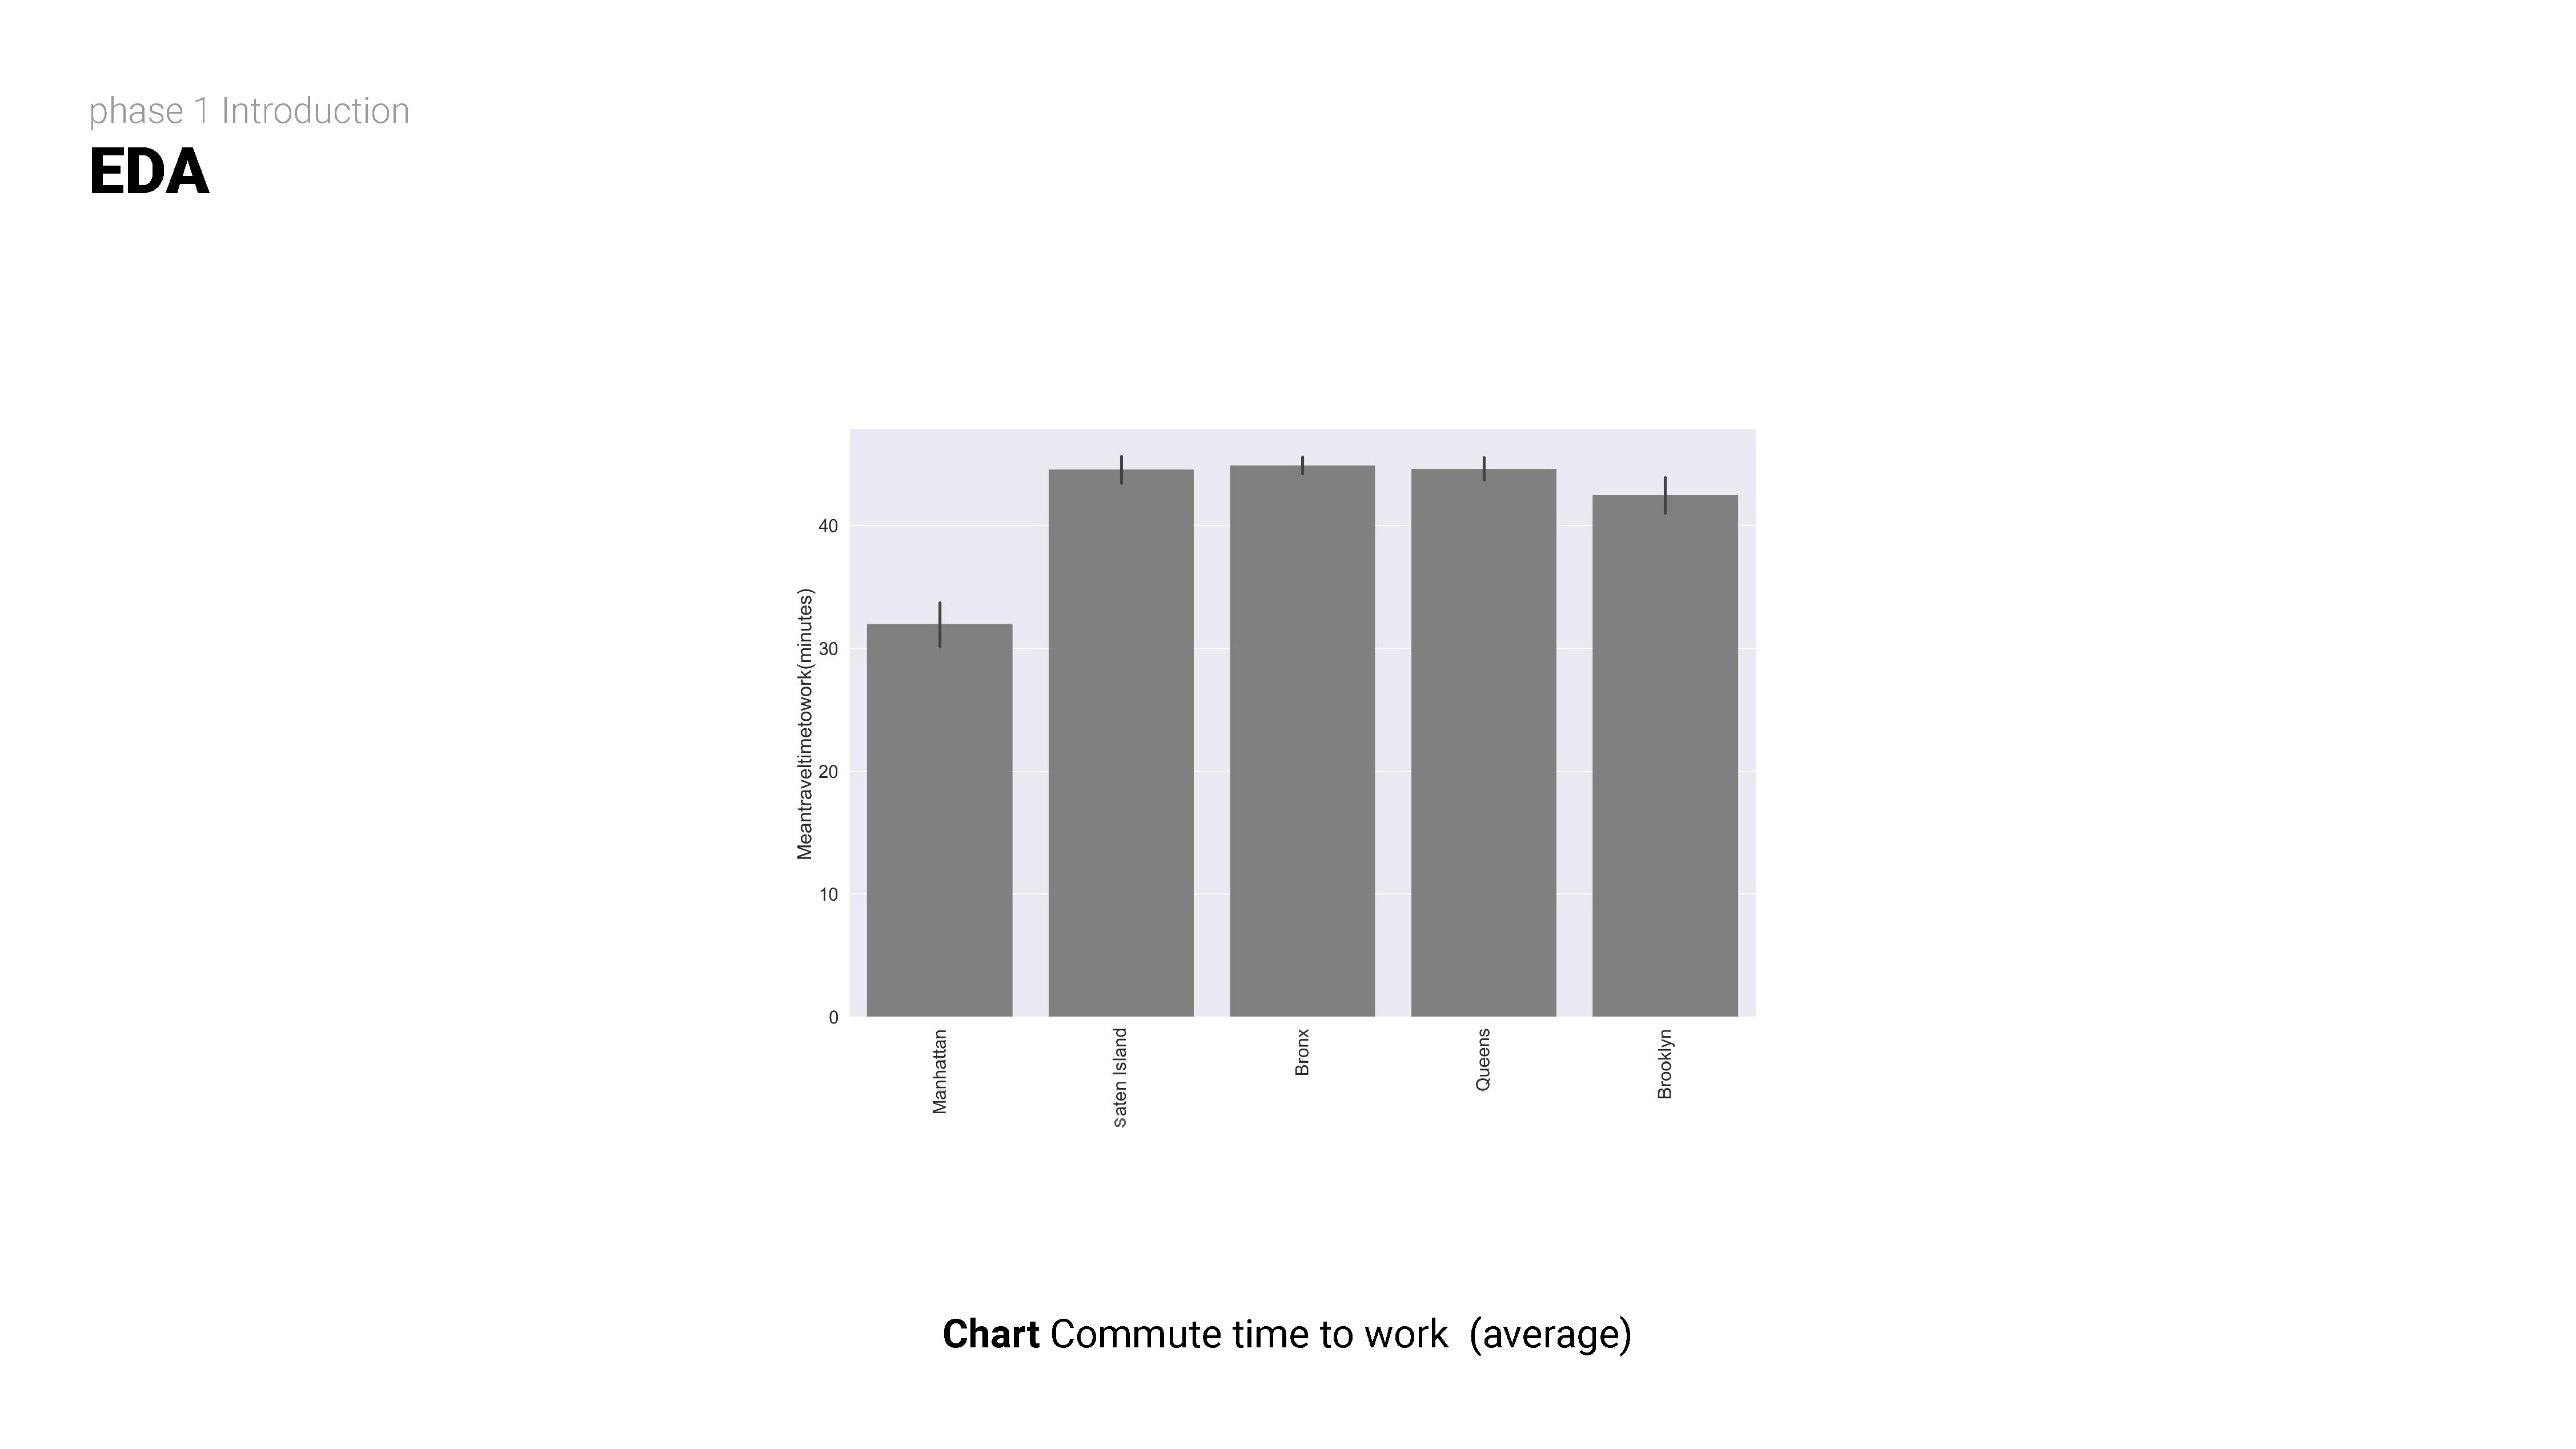
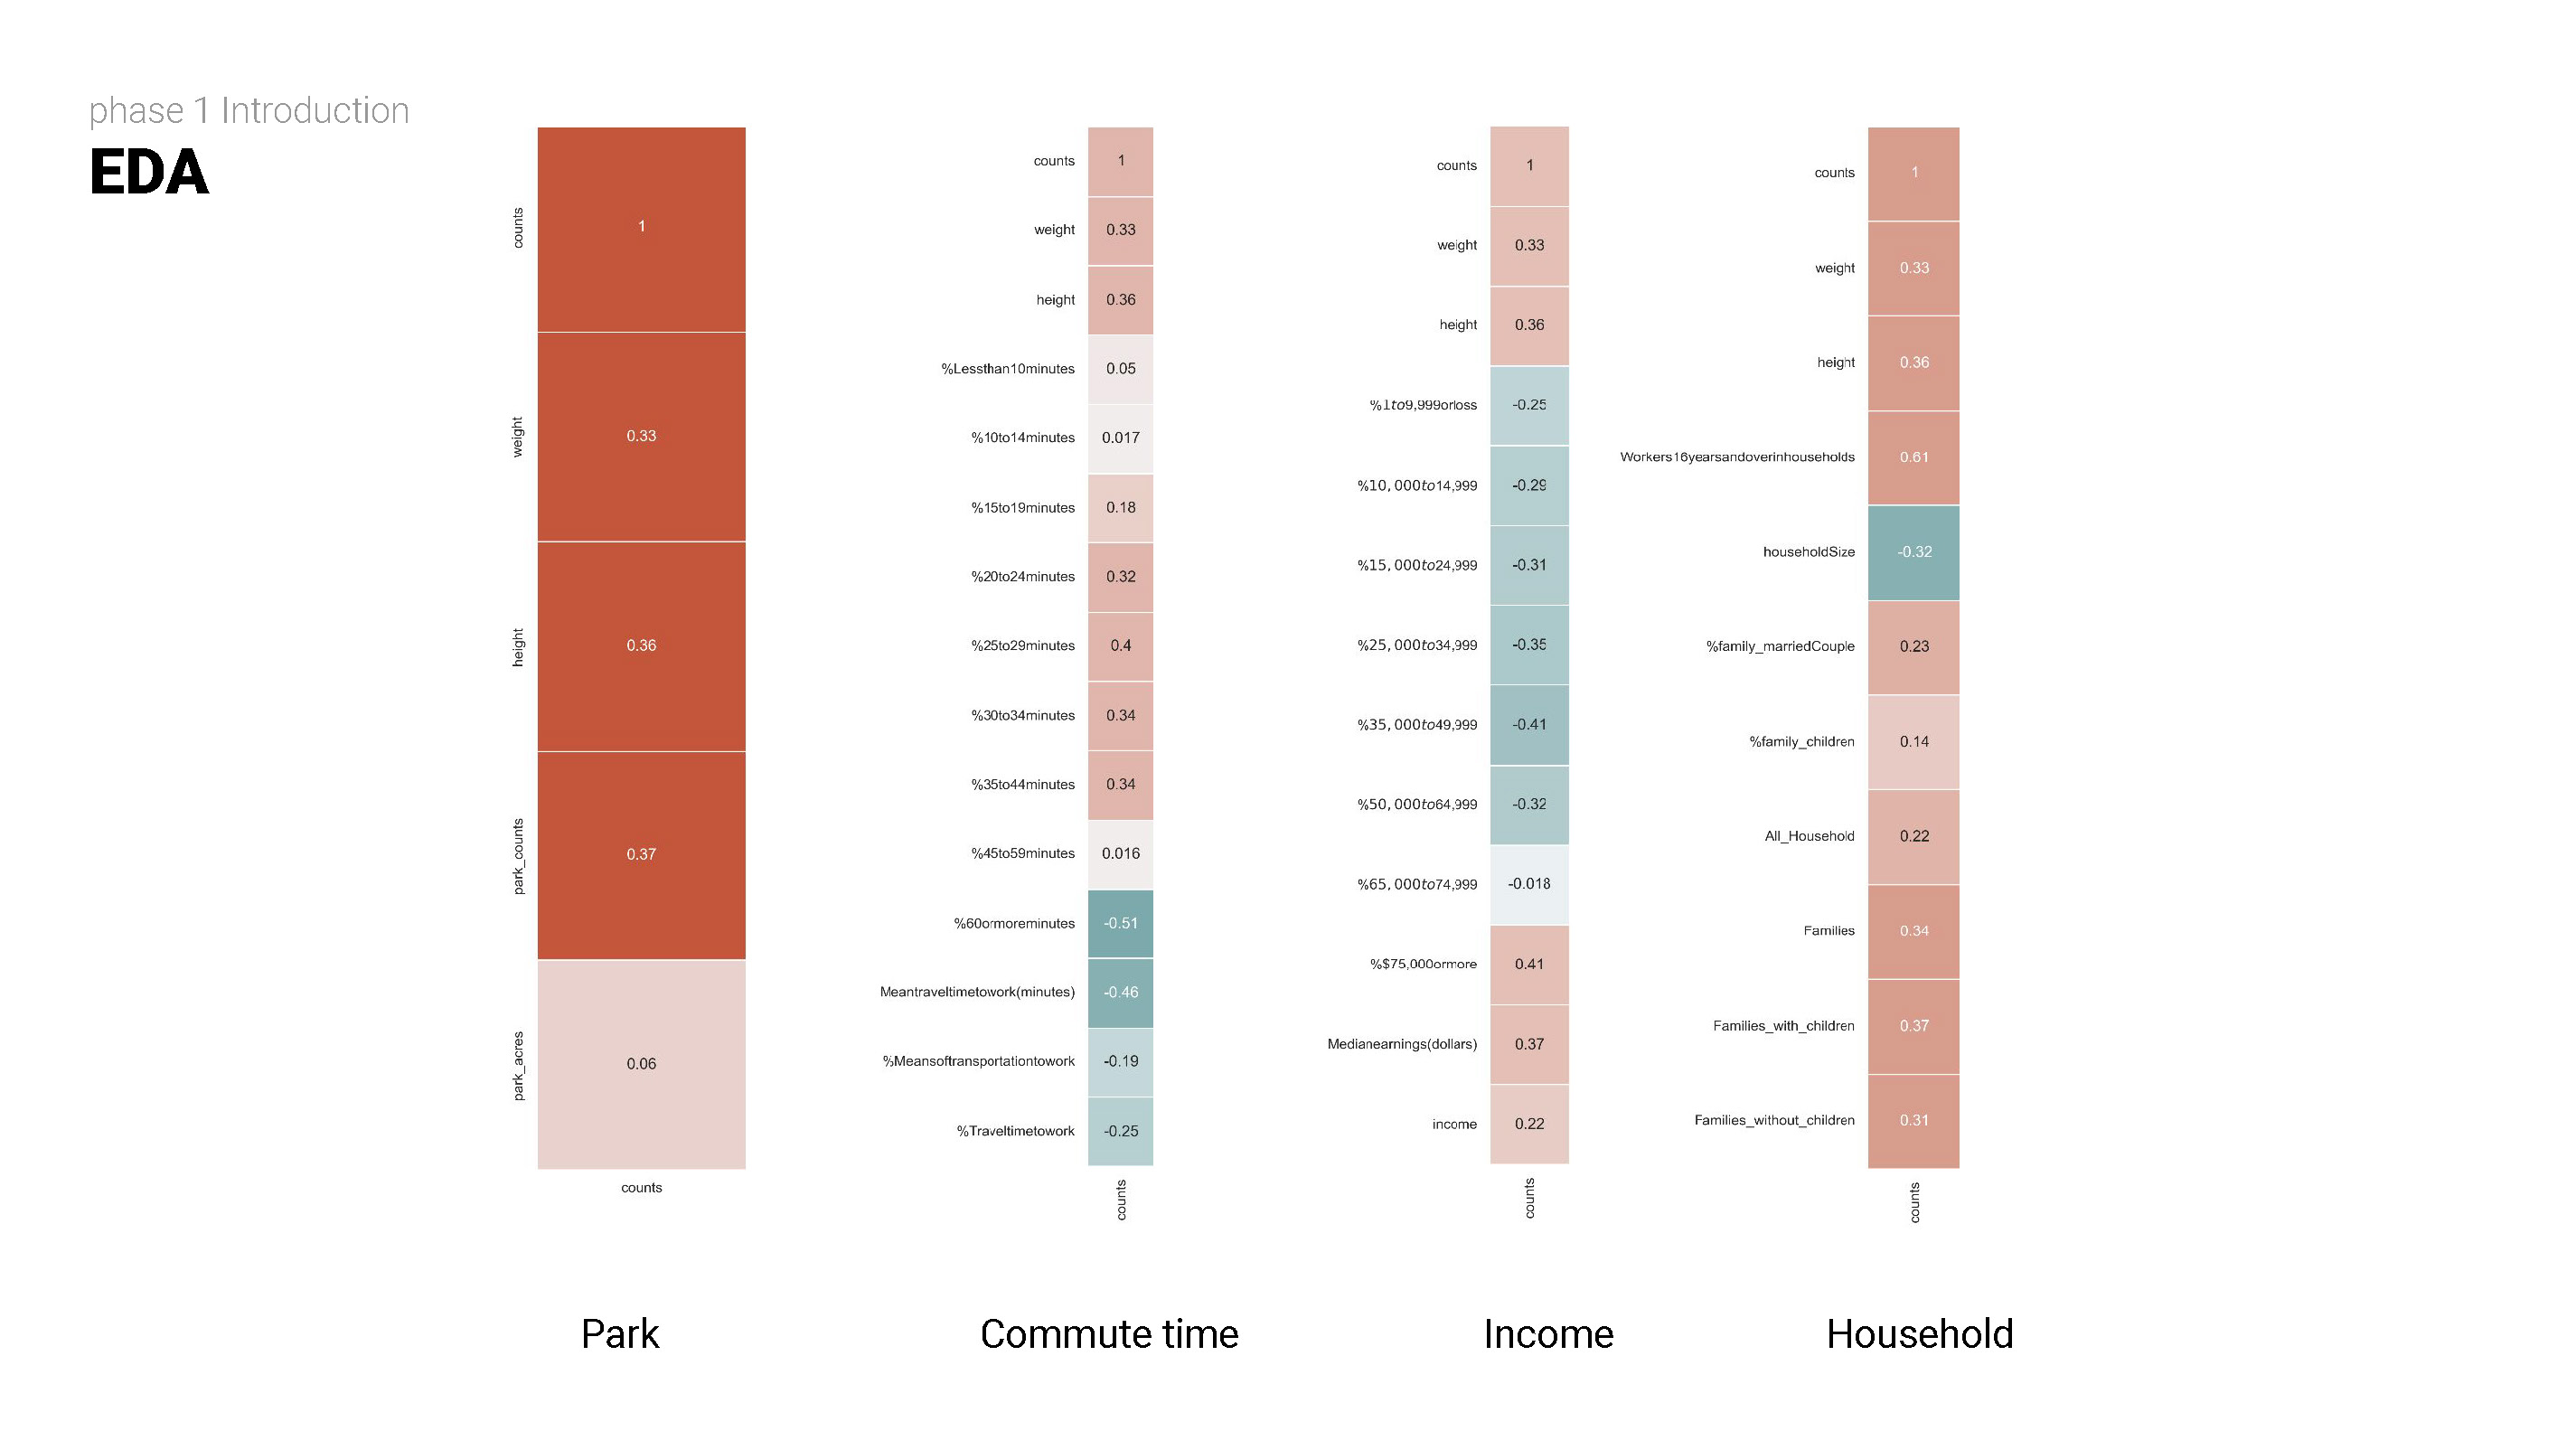
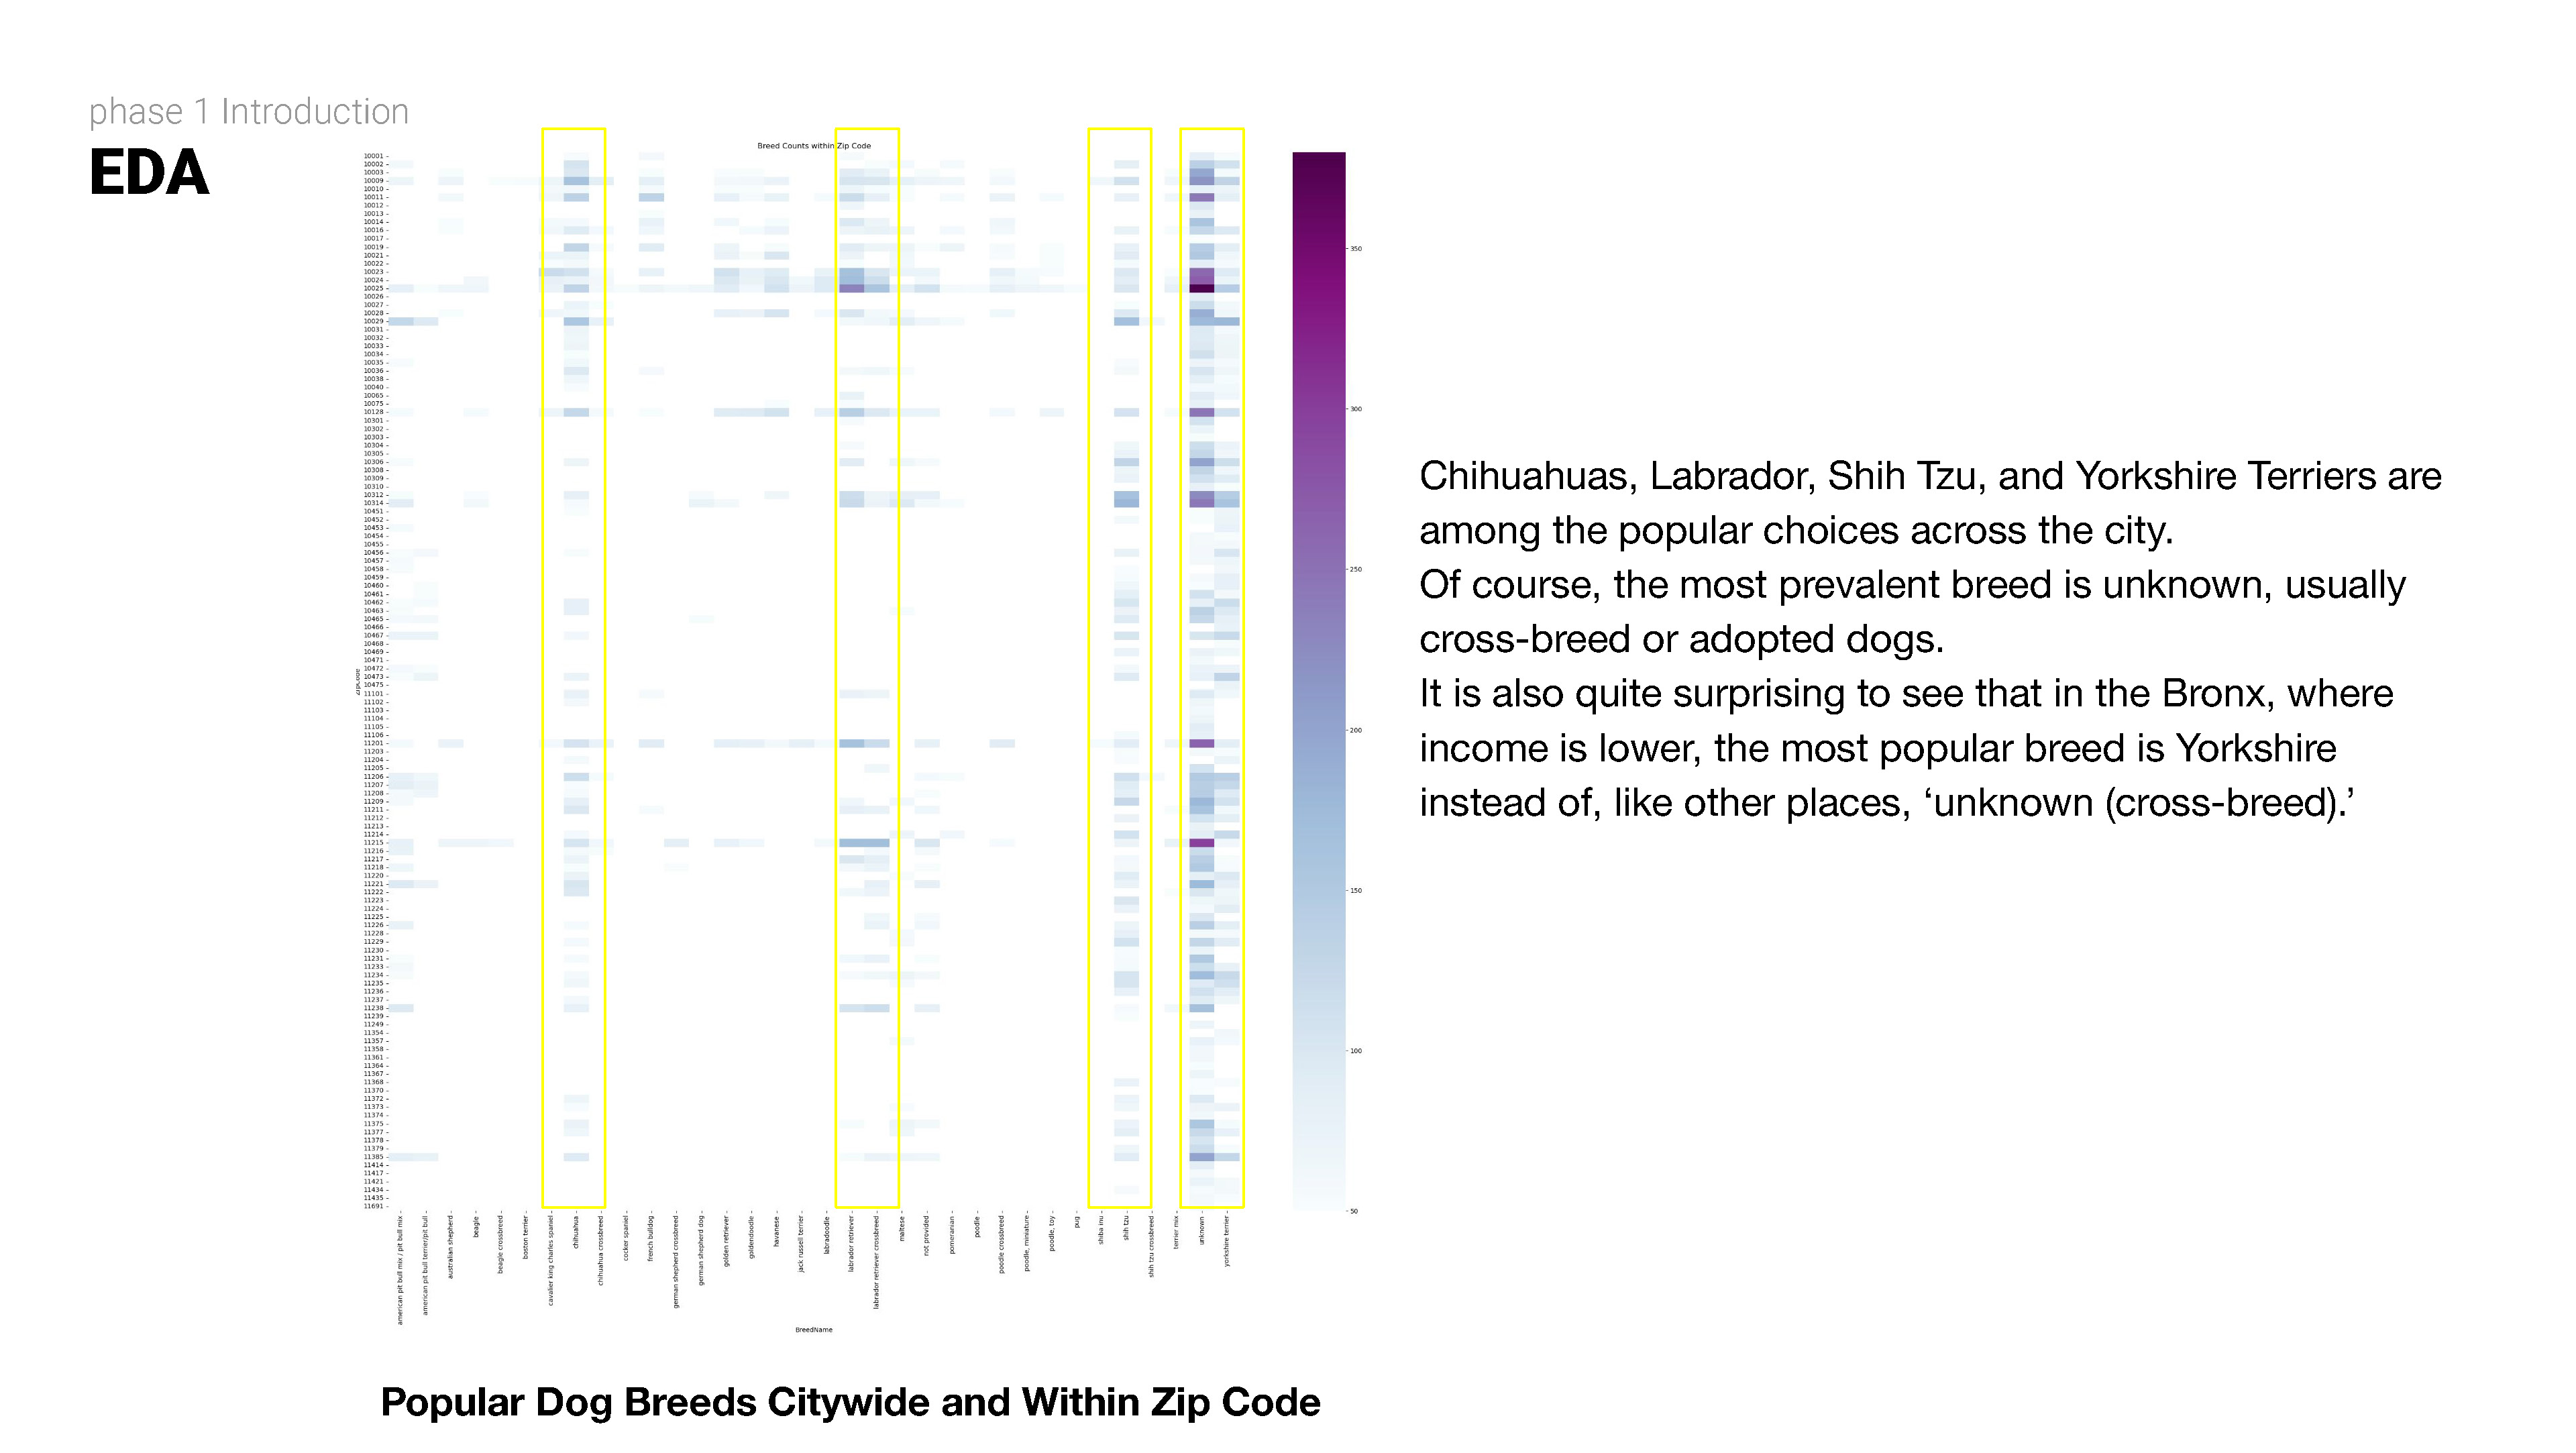
Exploratory Data Analysis
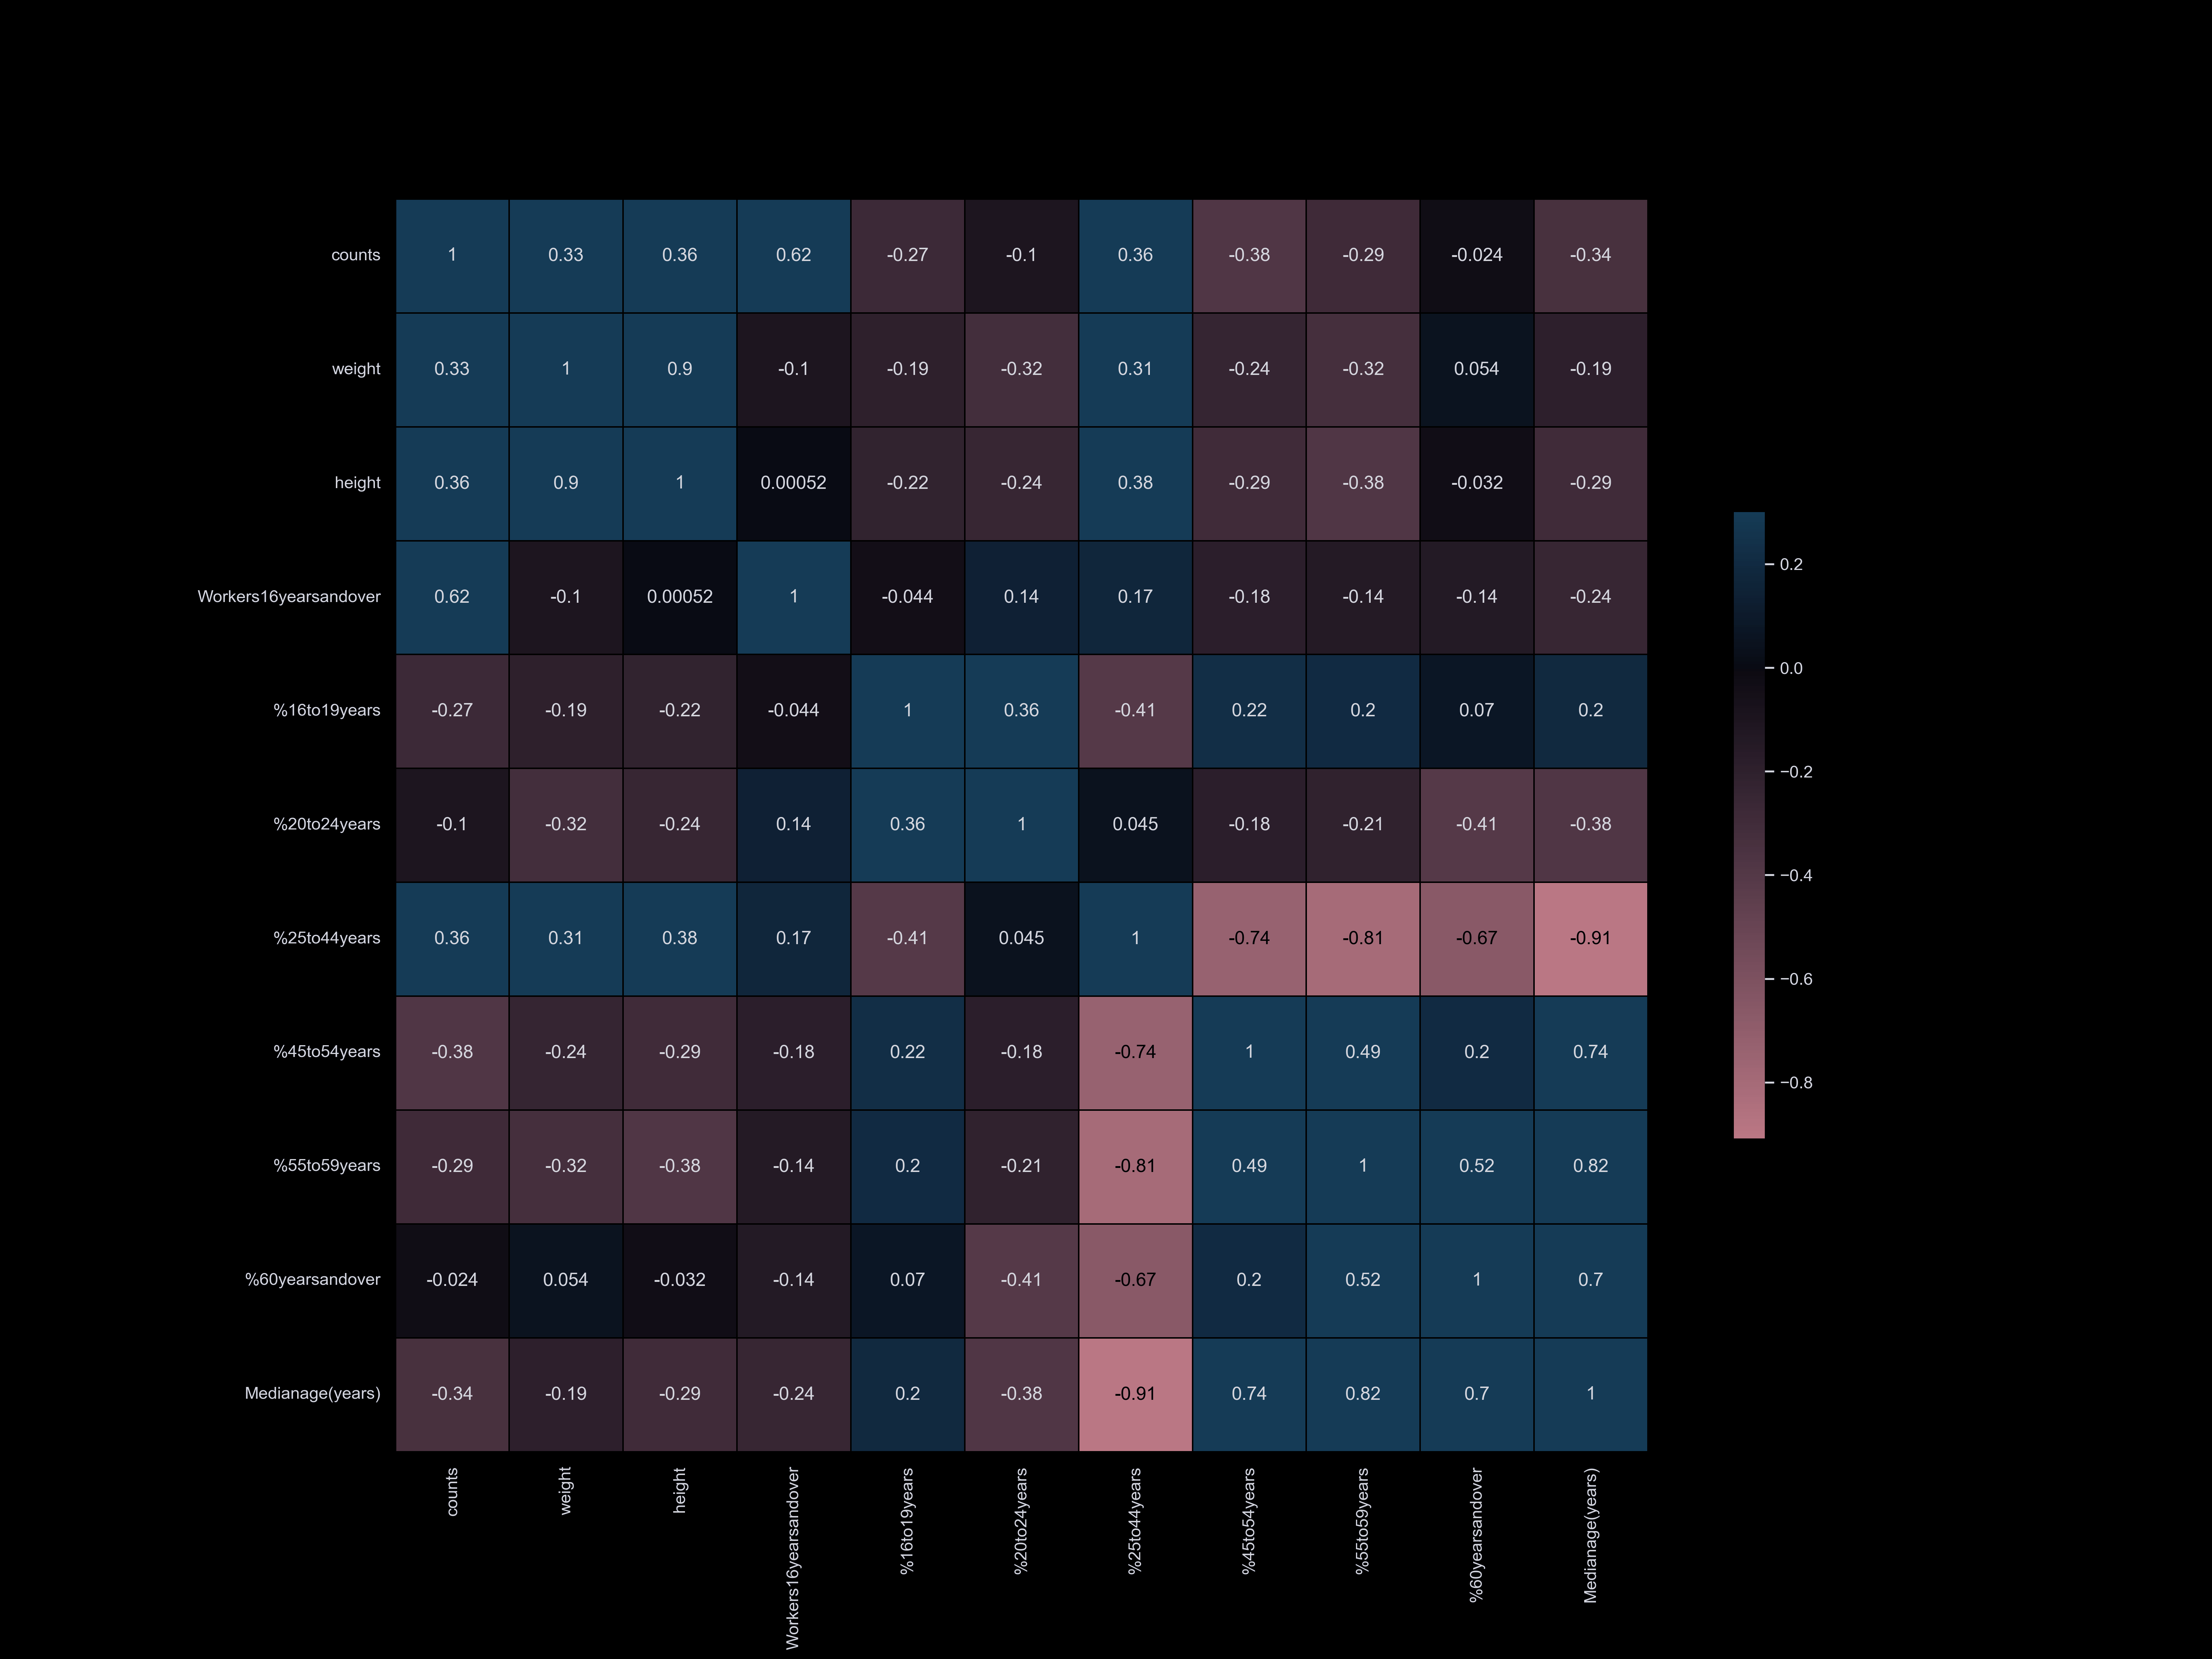
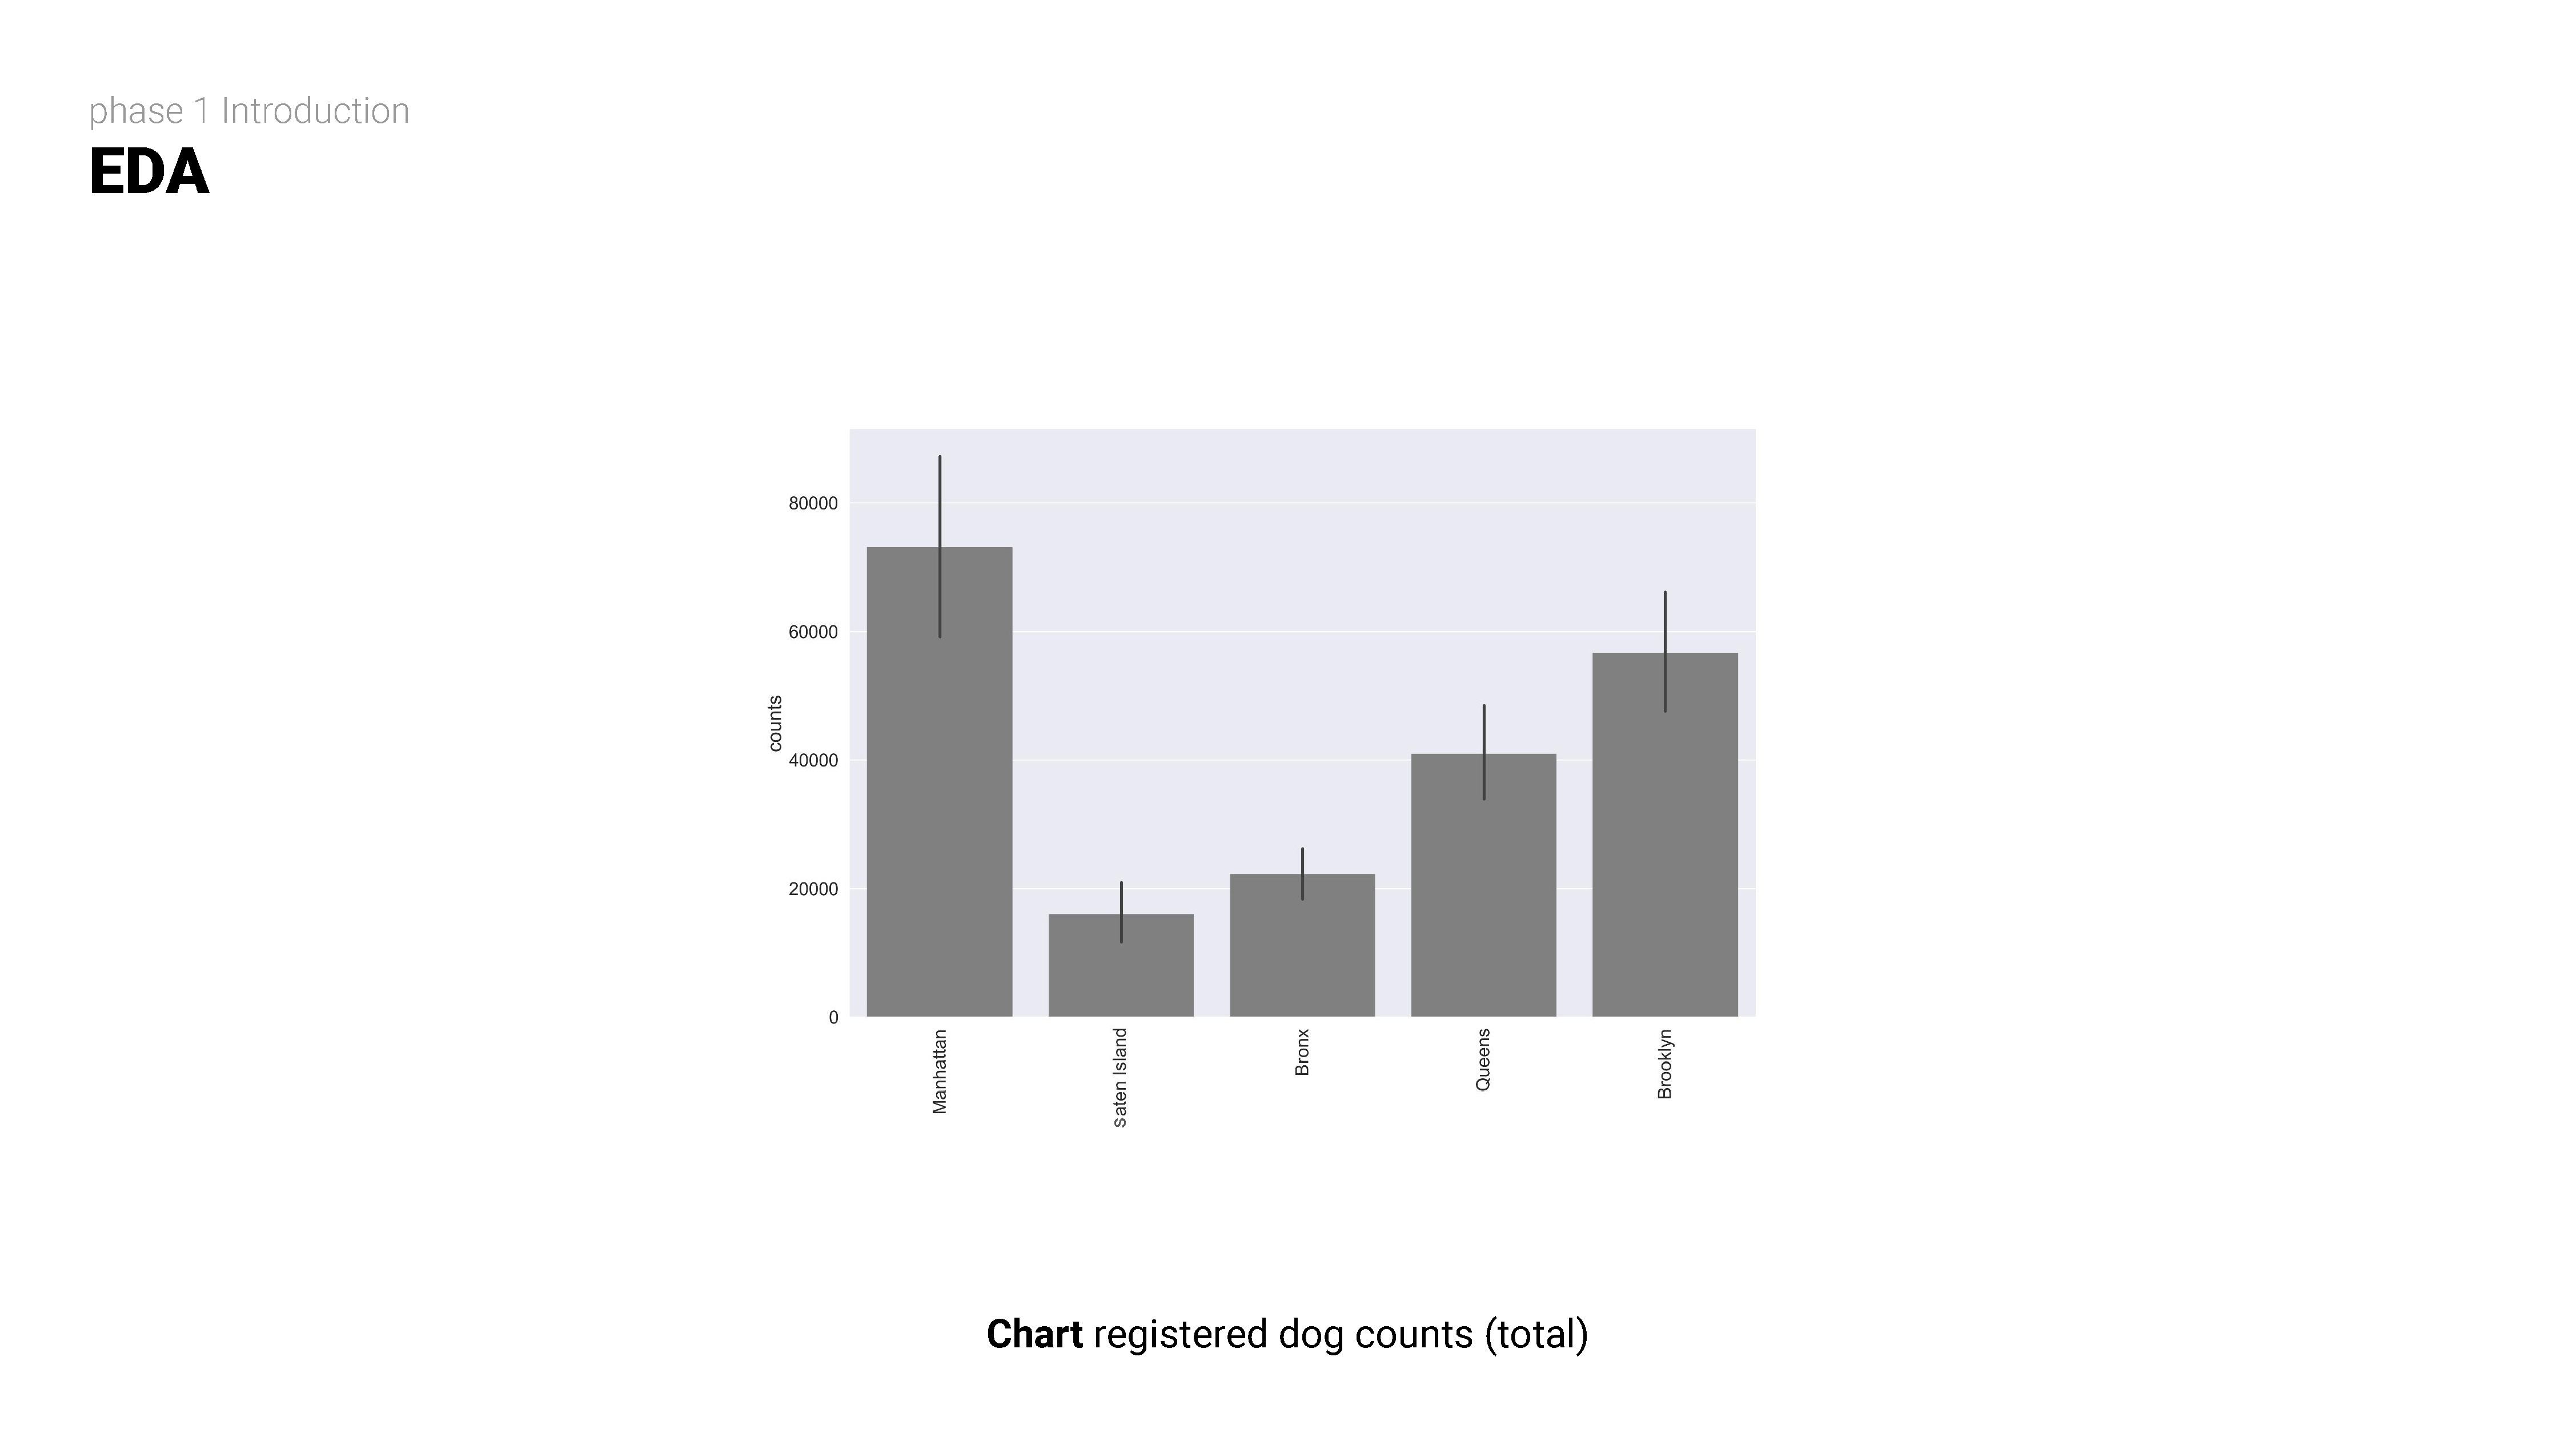
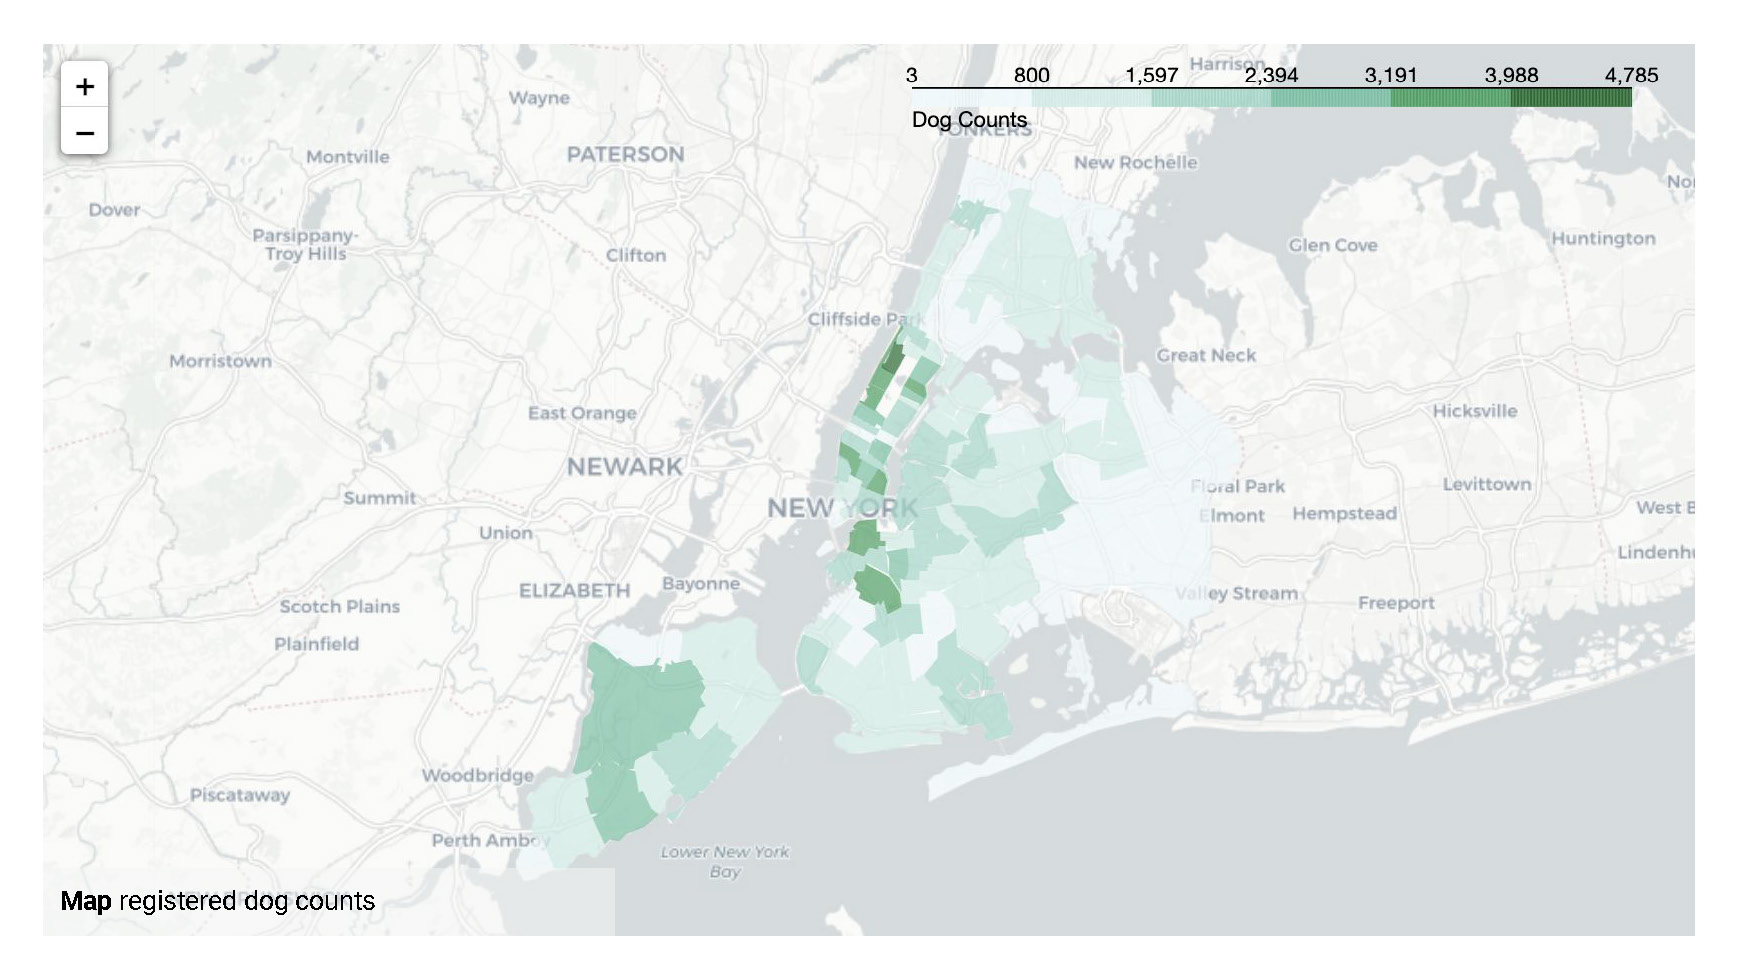
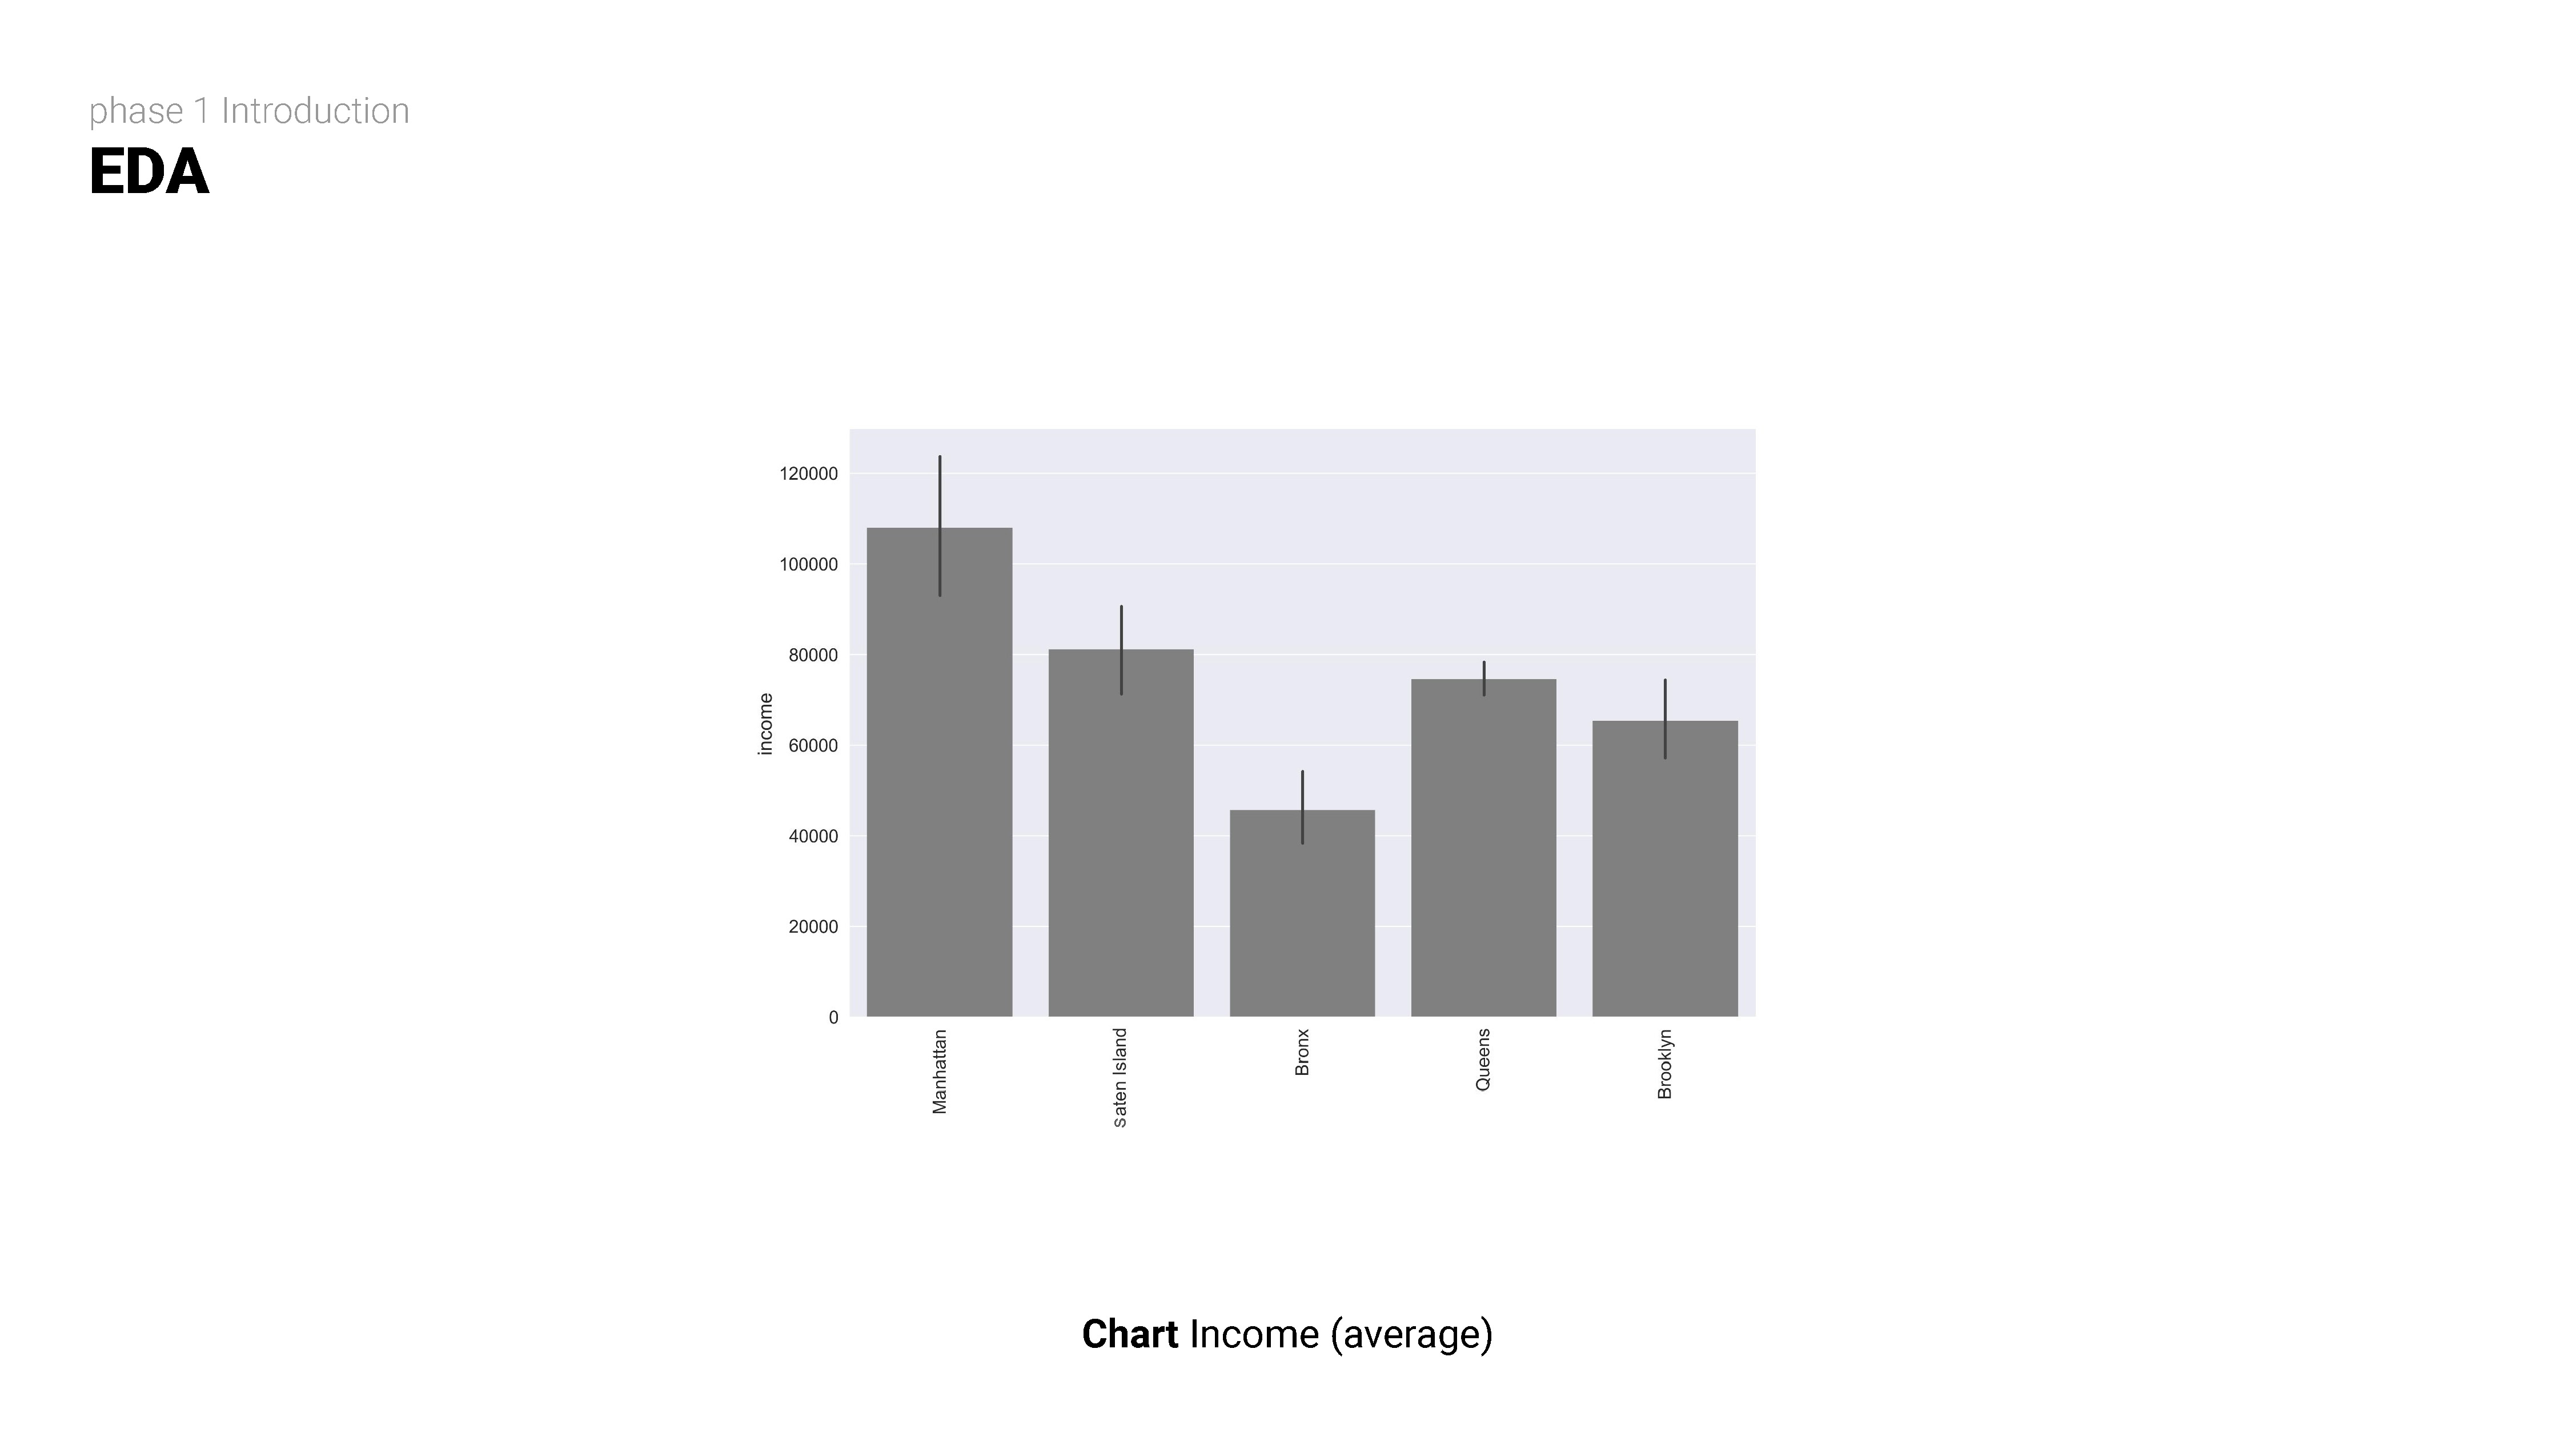
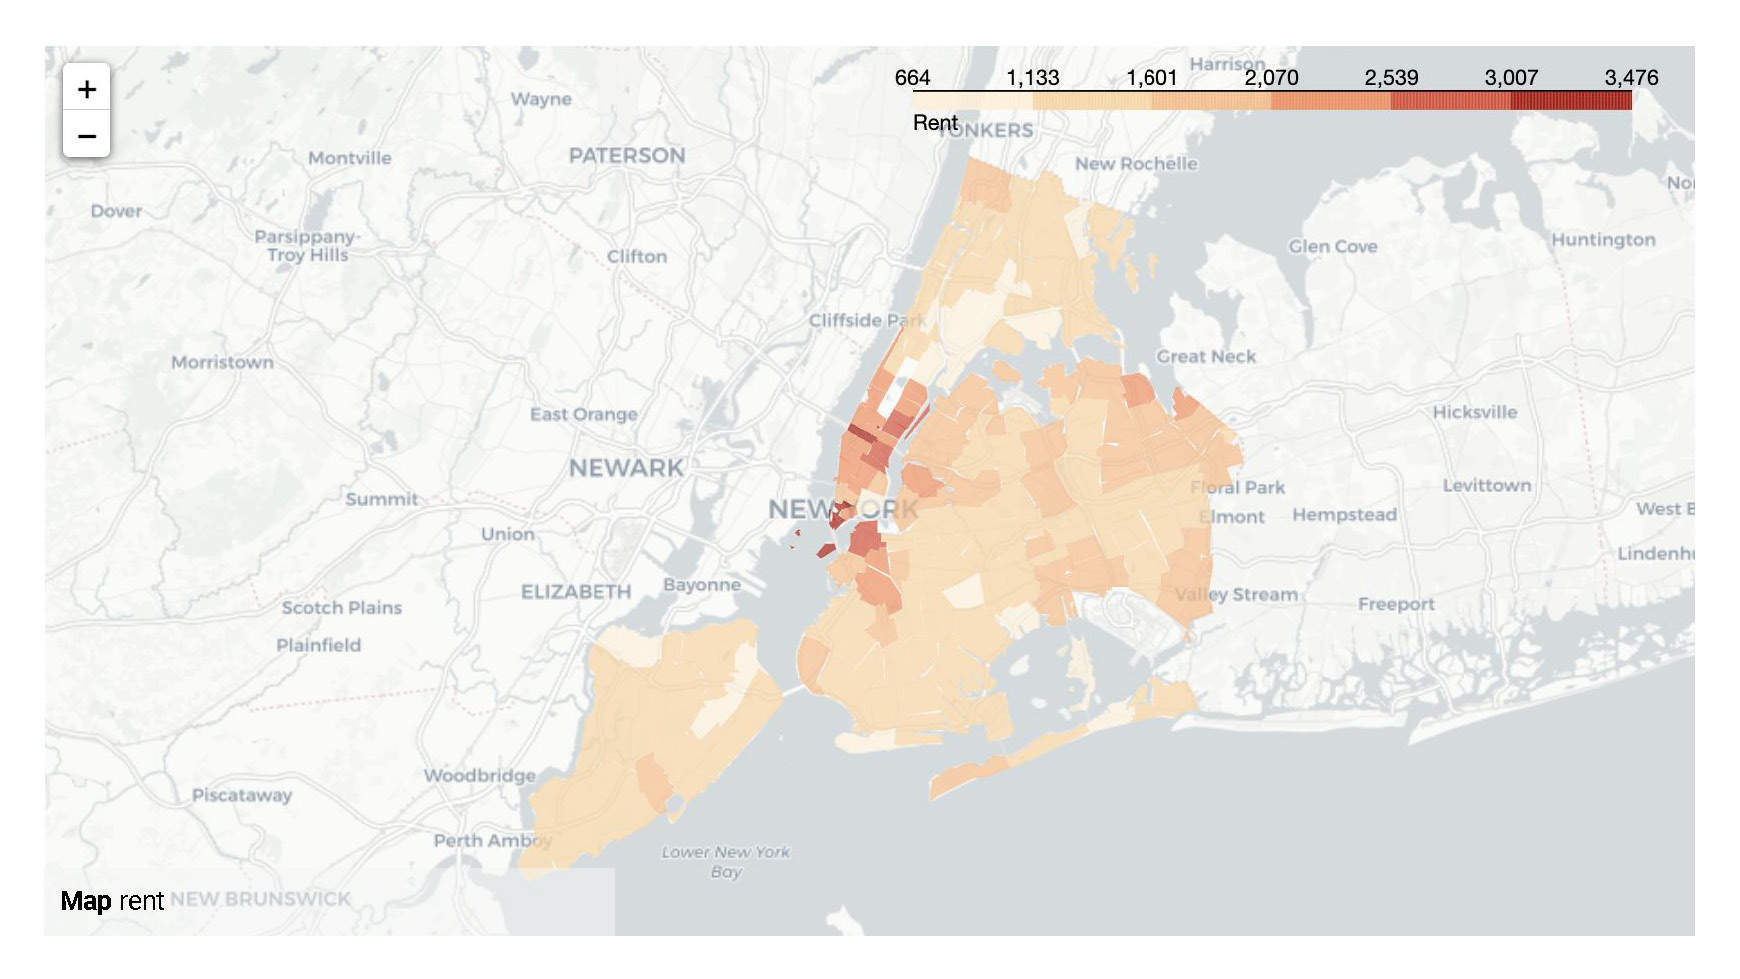
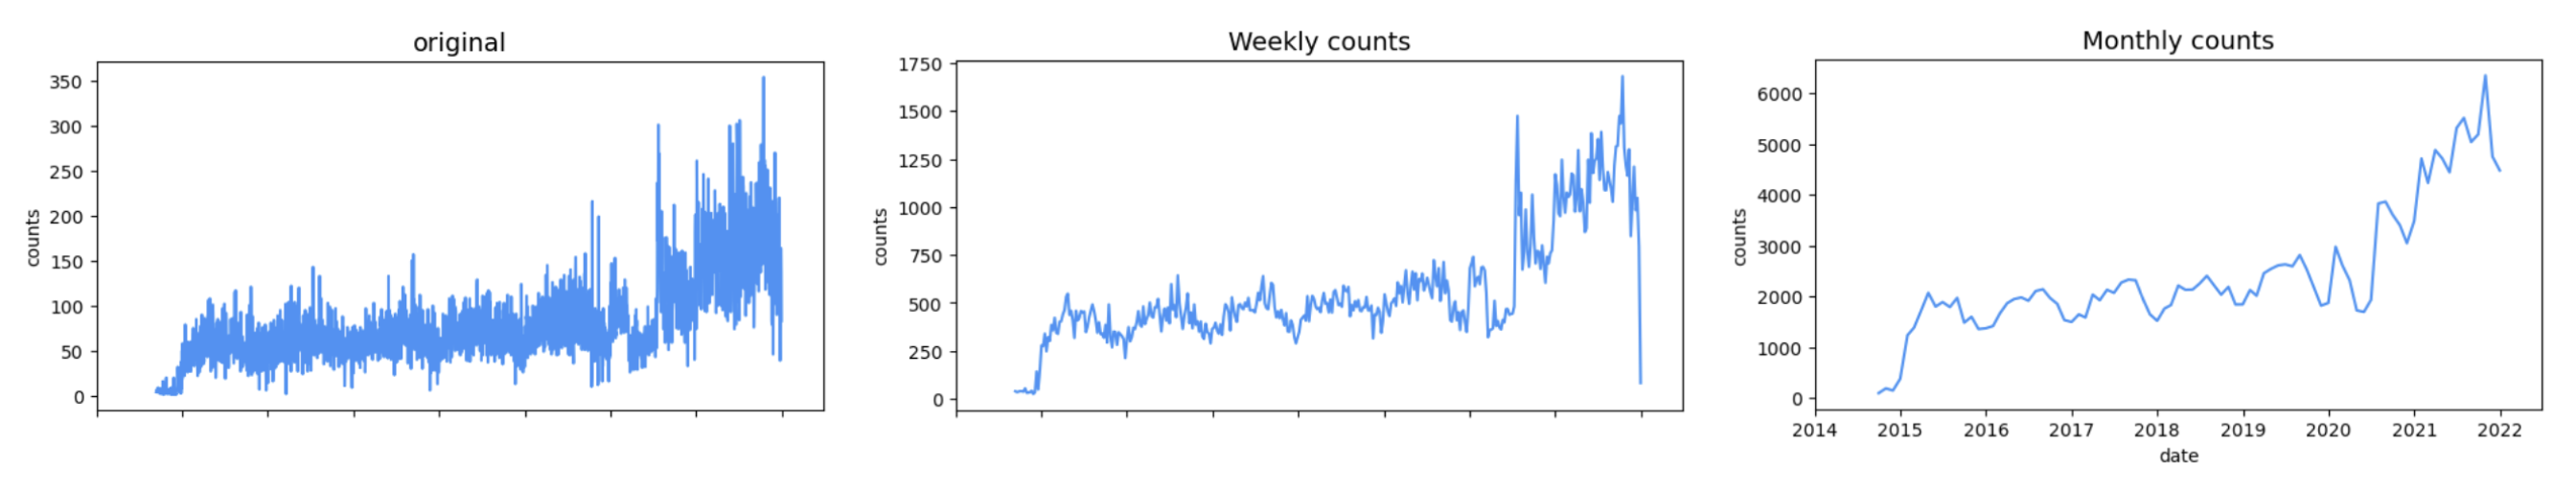
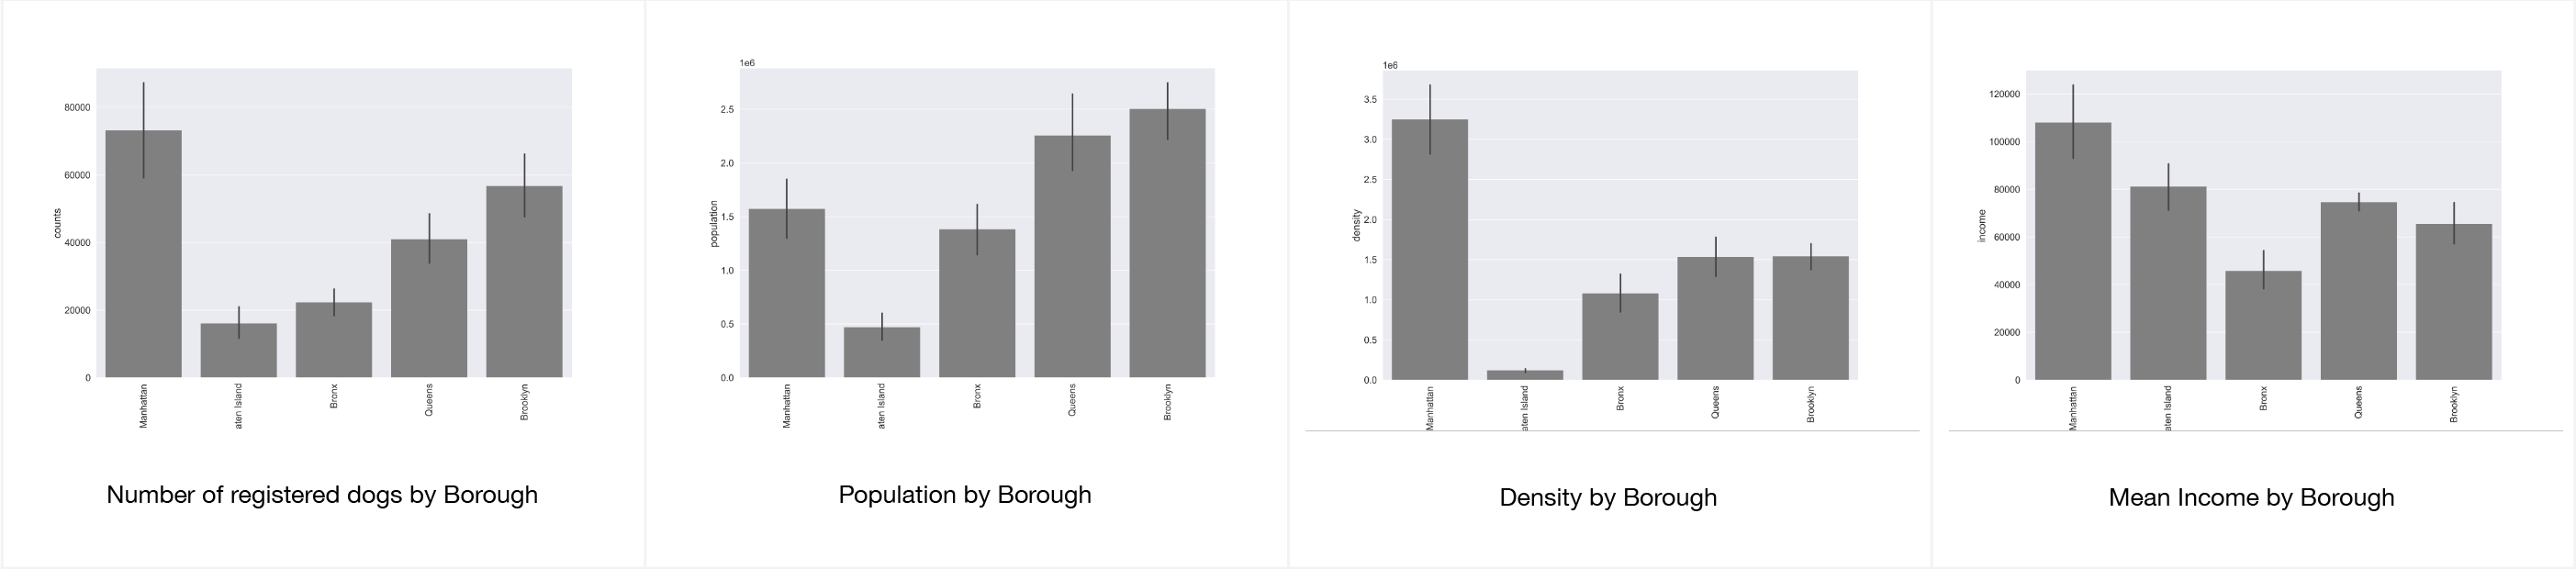
Exploratory data analysis (EDA) involves delving deep into datasets, uncovering patterns, relationships, and insights to gain a comprehensive understanding of the data. It serves as a preliminary step in the data analysis process, providing valuable insights and guiding further investigation and decision-making.
STEP TWO
Exploratory Data Analysis
Exploratory data analysis (EDA) involves delving deep into datasets, uncovering patterns, relationships, and insights to gain a comprehensive understanding of the data. It serves as a preliminary step in the data analysis process, providing valuable insights and guiding further investigation and decision-making.
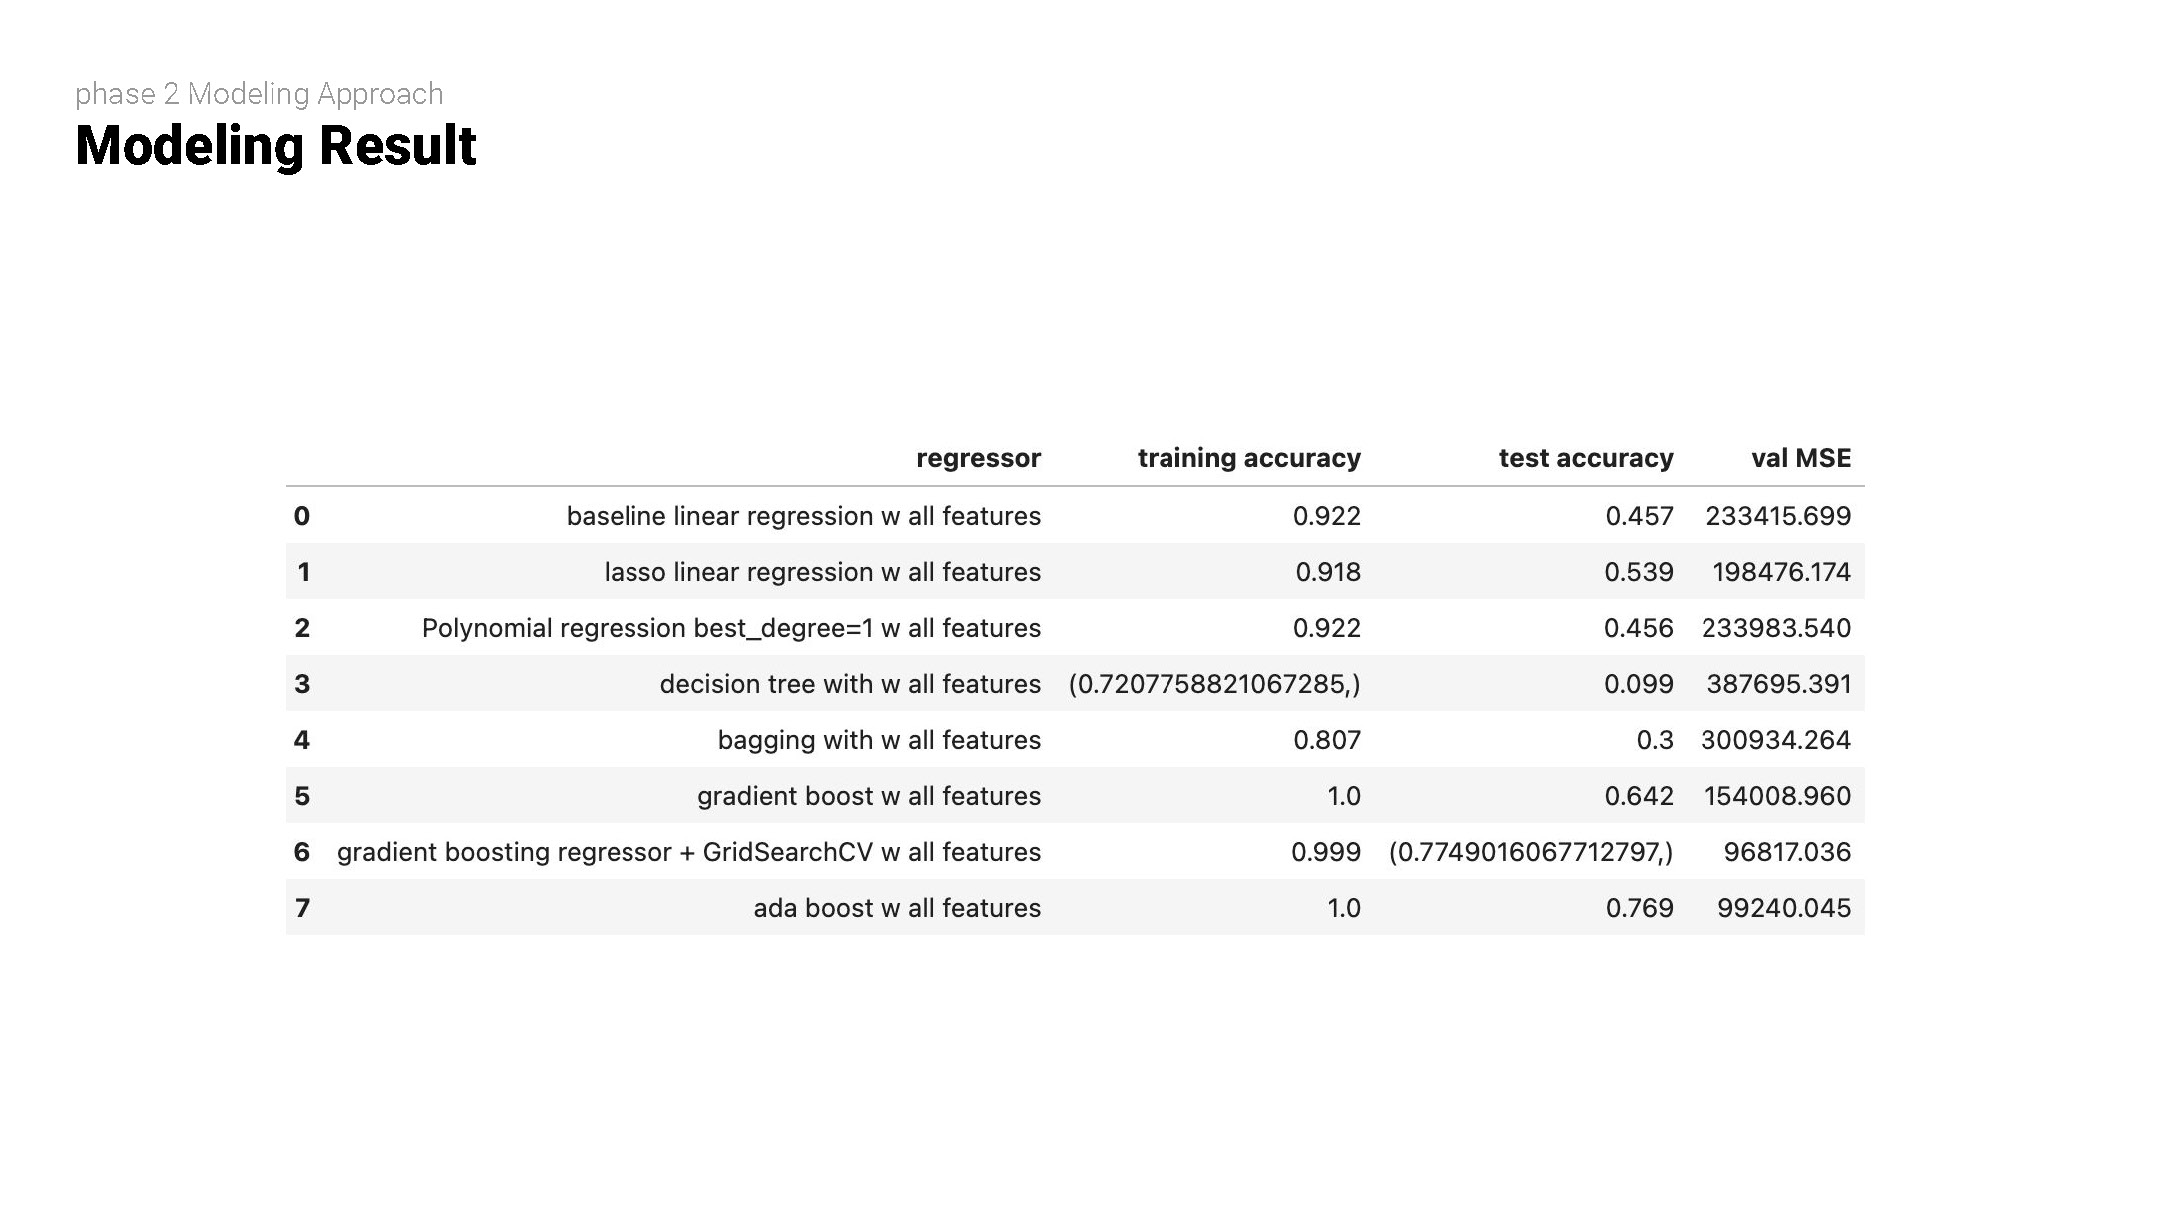
STEP TWO
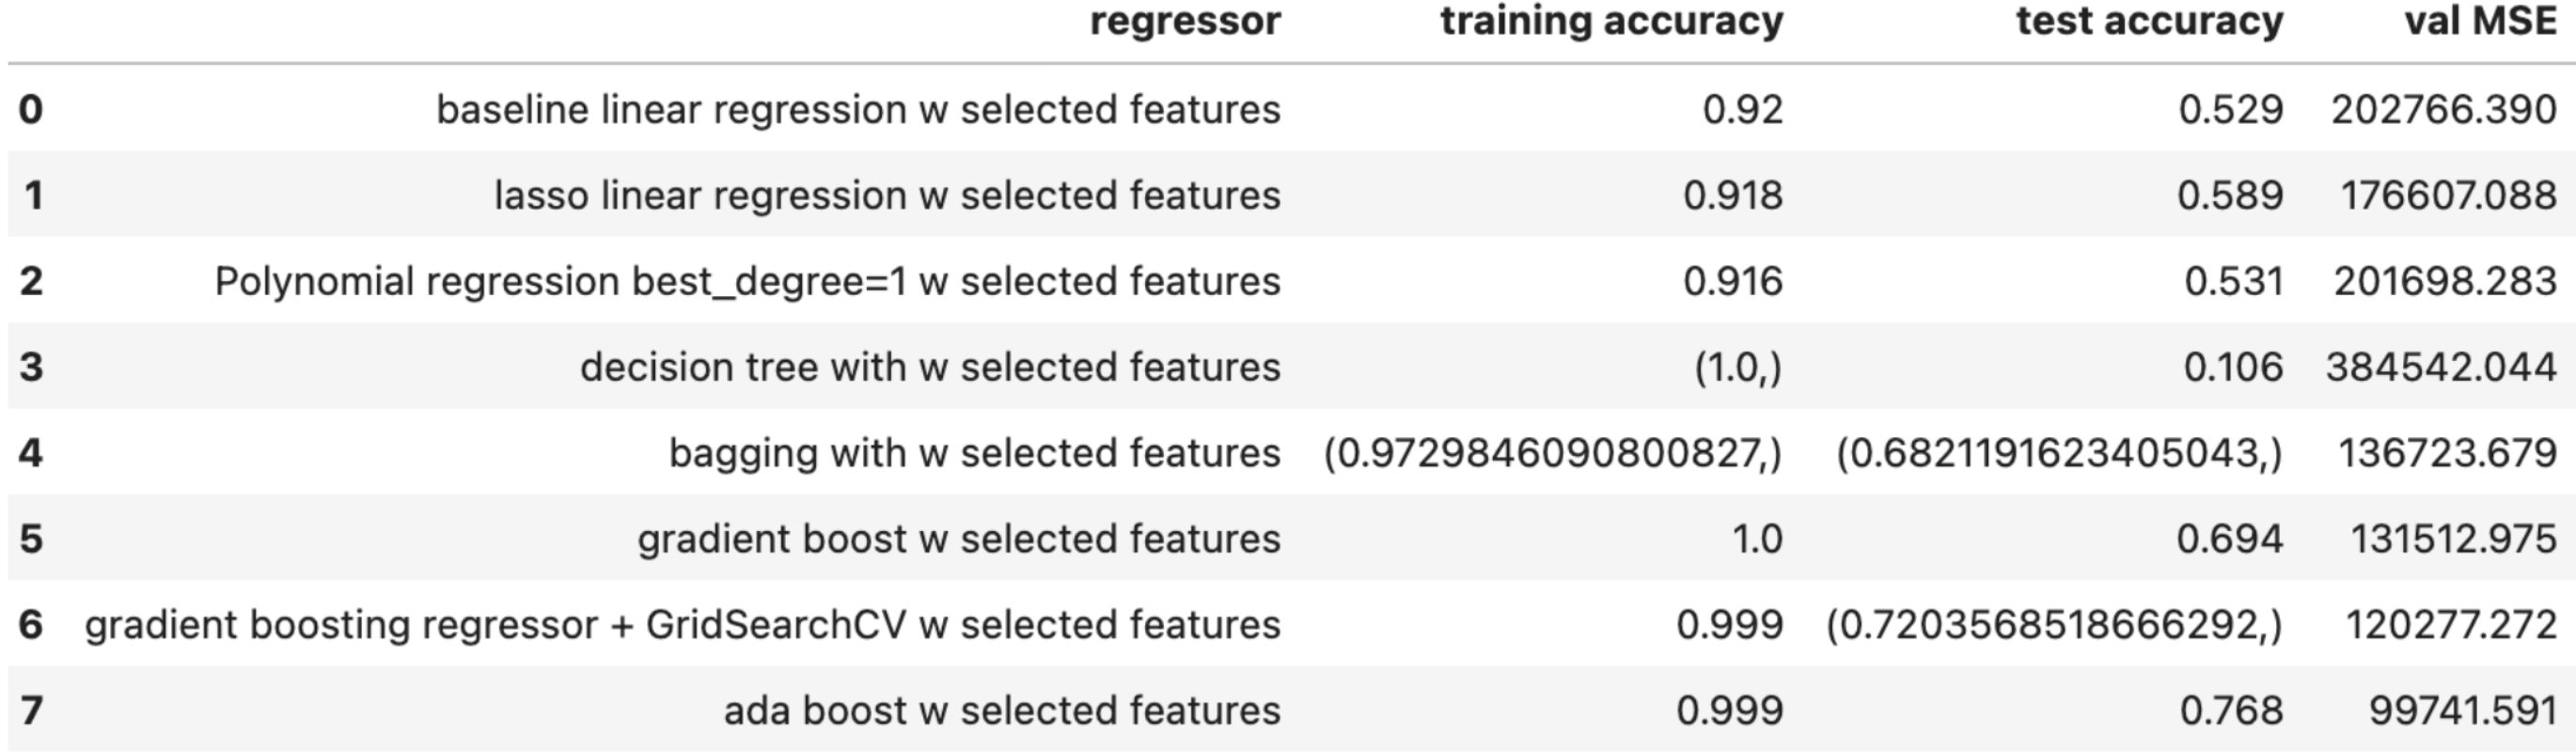
1. set our baseline model as Linear Regression without penalization;
2. add lasso regularization to get a sense of trivial features (which will be fed in 4.2);
3. cross-validation to determine the best degree for Polynomial Regression, thebest_degree we get is 1;
4. grid search cross validation to get the optimal max_depth for decision tree regressor,plot feature importance for EDA;
5. bagging regressor with the decision tree from the previous step as base estimator
6. gradient boosting with an initial setup
7. grid search cross-validation with gradient boosting for optimal:n_estimators; learning rate; subsampled. max_depth
8. (wild card) our small data size is not expensive in computation; we nest the optimalGradient Boost Regressor within Ada Boost Regressor and get a better result
9. result table:
Model with All Features
1. set our baseline model as Linear Regression without penalization;
2. add lasso regularization to get a sense of trivial features (which will be fed in 4.2);
3. cross-validation to determine the best degree for Polynomial Regression, thebest_degree we get is 1;
4. grid search cross validation to get the optimal max_depth for decision tree regressor,plot feature importance for EDA;
5. bagging regressor with the decision tree from the previous step as base estimator
6. gradient boosting with an initial setup
7. grid search cross-validation with gradient boosting for optimal:n_estimators; learning rate; subsampled. max_depth
8. (wild card) our small data size is not expensive in computation; we nest the optimalGradient Boost Regressor within Ada Boost Regressor and get a better result
9. result table:

STEP TWO
The model approach is the same, but instead of using all features, we select thefeatures from the lasso model whose coefficients are not 0
Model with Selected Features
The model approach is the same, but instead of using all features, we select thefeatures from the lasso model whose coefficients are not 0
STEP THREE
Final Visualization
We created data visualizations capturing the visual narrative and user experience flow of the website, ensuring a seamless journey for visitors.
Final Visualization
We created data visualizations capturing the visual narrative and user experience flow of the website, ensuring a seamless journey for visitors.